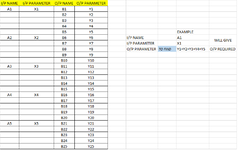
My query is regarding MS Excel. Please refer below image for better understanding. I have one input data and it parameter, for which I get multiple output data and their respective parameters. I need to build a table where I feed the input data and receive a sum of output data parameters.
-
If you would like to post, please check out the MrExcel Message Board FAQ and register here. If you forgot your password, you can reset your password.
FIND SUM OF MULTIPLE OUTPUT DATA FOR SINGLE INPUT DATA UNTIL NEXT INPUT DATA IS FOUND
- Thread starter cclp
- Start date

Similar threads
- Question
- Question
- Question


