Help with Calculating Stacked payments using banding eg tax

MikeXYZ7

New Member
Joined
Aug 11, 2017
Messages
35
Hi there

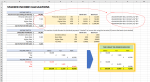
I am hoping someone can take pity on me and put me out of my misery? I have been trying to figure this out for hours! I am trying to get on top of my finances and want to make a "calculator" that can automatically work out out TAX DUE for PAYE & DIVIDENDS (both use different tax %). Hopefully this is obvious on the screen shot attached.

I have done this successfully for the first part eg assuming a £50k PAYE start, i have successfully worked out how to automatically work out the tax (please note that as i can't attach the excel file, i have shown the formula i have used in the attachment).

What i need to be able to do (and need help with) is to have a start point of £50k going into the second part (DIVIDEND section) and then allocate tax against the new income of £50k (for example) using the new tax % as shown in the figures. And it is here i just cannot work out what to do? I have tried lots of attempts but cannot get my head round how to approach this automatically (it is easy to manually do it - i have shown the answer ii am trying to achieve).

Please can someone put me out of my misery?

Best wishes

Mike
 

Attachments

  • MrExcel Support Request.png
    MrExcel Support Request.png
    88.7 KB · Views: 41
I finally see how they are adjusting the dividend tax table.
The equivalent single formula that reflects incremental tax rates and revised band limits shown in D22
mrexcel_20200416.xlsm
BCD
17DIVIDEND PAYMENTS60000
18Dividend Allowance0
19Basic Rate1350
20Higher Rate13000
21Top Rate0
22TAX TO PAY IN THIS SLICE1435014350
Sheet18
Cell Formulas
RangeFormula
C18C18=(MAX(MIN($H18-$G18, C$17-$H18), 0))*$F18
C21C21=(MAX(MIN($H21-$G21, C$17-$G21), 0))*$F21
C22C22=SUM(C18:C21)
D22D22=SUMPRODUCT(--(C17>={0;2000;20000;120000}),(C17-{0;2000;20000;120000}),{0;0.075;0.25;0.056})
 
Upvote 0

Excel Facts

Format cells as time
Select range and press Ctrl+Shift+2 to format cells as time. (Shift 2 is the @ sign).
Essentially, you keep the dividend allowance unchanged...it remains 0-2000; and then the upper band limits are set at their published value minus the "total income (excluding dividends)" amount...which in this example is 30000. So subtraction of the upper band limits gives 20000, and 120000. The incremental tax rates reflect the change in tax rate as one moves from one band to the next higher band...so we start at 0%, move up to 0.075 (a change of +0.075), then move up to 0.325 (a change of +0.25), and then move up to 0.381 (a change of 0.056). Now that the adjustments to the published tier limits are understood, if you prefer to keep the table and show the different tier tax amounts, you could construct a helper table beside the one in your sheet to create these revised limits 0-2000, 2000-50000, 50000-150000, 150000-1000000 and then use that revised table as demonstrated in Dave's post.
 
Upvote 0
Something like this, where some helper cells show the revised tax table, as well as the dividend amounts allocated to each tier, and a running tally of the remaining dividends to allocate. I'm still not sure about how the tax table would be adjusted if total income exceeded the upper limit on the dividend "basic rate" tier. In this example, 30000 of income causes an effective shift down in the dividend basic rate tier, lowering the upper end to 20000. But what happens if income were, say, 80000?

mrexcel_20200416.xlsm
ABCDEFGHIJKL
7
8WAGES INCOME PART A
9Total Income (Excluding Dividends)30000Band startBand end
10Personal Allowance0Personal Allowance0012500
11Basic Rate3499.8Basic Rate0.21250150000
12Higher Rate0Higher Rate0.450001150000
13Top Rate0Top Rate0.451500011000000
14TAX TO PAY IN THIS SLICE3499.8
15
16DIVIDENDS INCOME PART BRemainder
17DIVIDEND PAYMENTS60000Band startBand endAdj startAdj endAllocation60000
18Dividend Allowance0Dividend Allowance00200002000200058000
19Basic Rate1350Basic Rate0.0752001500002000200001800040000
20Higher Rate13000Higher Rate0.3255000115000020000120000400000
21Top Rate Top Rate0.3811500011000000120000970000  
22TAX TO PAY IN THIS SLICE1435014350<-- single formula
Sheet18
Cell Formulas
RangeFormula
C10C10=(MAX(MIN($H10-$G10, C$9-$H10), 0))*$F10
C11:C13C11=(MAX(MIN($H11-$G11, C$9-$G11), 0))*$F11
C14,C22C14=SUM(C10:C13)
L17L17=C17
I18:J18I18=G18
K18:K21K18=IF(L17>0,IF(L17>J18,J18-I18,L17),"")
L18:L21L18=IF(L17>0,L17-K18,"")
I19:I21I19=J18
J19:J21J19=H19-$C$9
C18:C21C18=IFERROR(K18*F18,"")
D22D22=SUMPRODUCT(--(C17>={0;2000;20000;120000}),(C17-{0;2000;20000;120000}),{0;0.075;0.25;0.056})
 
Upvote 0
Do you know the correct amount per the Tax Authorities for 30,000 +60,000?
Review the following and check to see if it provides the correct result.
N.B. I have no information or knowledge of the U.K. tax system.
You can use Excel's Formula Evaluate to step through the formula.

This may be an arithmetic exercise or it may be useful.
This is entirely based on assumptions.

T202004a.xlsm
ABCDEFG
1Income
2Regular30,000.003,500.00
3Dividends60,000.0014,350.00
490,000.0017,850.00
5
6Regular IncomeDividend Income
7BracketsRatesRate DiffBracketsRatesRate Diff
80.000%0.00%0.000.0%0.00%
912,500.0020%20.00%2,000.007.5%7.50%
1050,000.0040%20.00%20,000.0032.5%25.00%
11150,000.0045%25.00%120,000.0038.1%5.60%
12
2bbbb
Cell Formulas
RangeFormula
C2C2=SUMPRODUCT(--(B2>A8:A11),B2-A8:A11,C8:C11)
C3C3=SUMPRODUCT(--(B3>rB),B3-rB,rDiff)
B4:C4B4=B2+B3
C8:C11C8=B8-N(C7)
E10E10=50000-B2
E11E11=150000-B2
G8:G11G8=F8-N(F7)
 
Upvote 0
edit to above
T202004a.xlsm
ABCDEFG
1Income
2Regular30,000.003,500.00
3Dividends60,000.0014,350.00
490,000.0017,850.00
5
6Regular IncomeDividend Income
7BracketsRatesRate DiffBracketsRatesRate Diff
80.000%0.00%00.0%0.00%
912,500.0020%20.00%2,0007.5%7.50%
1050,000.0040%20.00%20,00032.5%25.00%
11150,000.0045%5.00%120,00038.1%5.60%
12100,000,00038.1%0.00%
2bbbb
Cell Formulas
RangeFormula
C2C2=SUMPRODUCT(--(B2>A8:A11),B2-A8:A11,C8:C11)
C3C3=SUMPRODUCT(--(B3>rB),B3-rB,rDiff)
B4:C4B4=B2+B3
G8:G12,C8:C11C8=B8-N(B7)
E10E10=50000-MIN(B2,50000)
E11E11=150000-MIN(150000,B2)
 
Upvote 0
With complete information, someone may work out a formula to adjust the table for your requirements.
You can consider the various increments and adjustments to brackets and rates.
The example below shows a formula for the modest salary and for high salary. Adjust the formula to your actual data. I included just one set of named ranges.
As an alternative, you could build your own UDF.

You can make your formula clearer by naming all the relevant ranges.

T202004a.xlsm
ABCDEFGHIJK
1Income
2Regular30,000.003,500.00
3Dividends60,000.0014,350.00
490,000.0017,850.00
5
6Regular IncomeDividend Income
7BracketsRatesRate DiffBracketsRatesRate DiffBracketsRatesRate Diff
80.000%0.00%00.0%0.00%00.0%0.00%
912,500.0020%20.00%2,0007.5%7.50%2,00038.1%38.10%
1050,000.0040%20.00%20,00032.5%25.00%
11150,000.0045%5.00%120,00038.1%5.60%
12
UK
Cell Formulas
RangeFormula
C2C2=SUMPRODUCT(--(B2>A8:A11),B2-A8:A11,C8:C11)
C3C3=IF(B2<50000,SUMPRODUCT(--(B3>rB),B3-rB,rDiff),IF(B2>150000,SUMPRODUCT(--(B3>I8:I9),B3-I8:I9,K8:K9),"adjust formula as required"))
B4:C4B4=B2+B3
G8:G11,C8:C11,K8:K9K8=J8-N(J7)
E10E10=50000-MIN(B2,50000)
E11E11=150000-MIN(150000,B2)
Named Ranges
NameRefers ToCells
rB=UK!$E$8:$E$11C3
rDiff=UK!$G$8:$G$11C3


T202004a.xlsm
ABCDEFGHIJK
1Income
2Regular500,000.00205,000.00
3Dividends500,000.00189,738.00
41,000,000.00394,738.00
5
6Regular IncomeDividend Income
7BracketsRatesRate DiffBracketsRatesRate DiffBracketsRatesRate Diff
80.000%0.00%00.0%0.00%00.0%0.00%
912,500.0020%20.00%2,0007.5%7.50%2,00038.1%38.10%
1050,000.0040%20.00%032.5%25.00%
11150,000.0045%5.00%038.1%5.60%
12
UK
Cell Formulas
RangeFormula
C2C2=SUMPRODUCT(--(B2>A8:A11),B2-A8:A11,C8:C11)
C3C3=IF(B2<50000,SUMPRODUCT(--(B3>rB),B3-rB,rDiff),IF(B2>150000,SUMPRODUCT(--(B3>I8:I9),B3-I8:I9,K8:K9),"adjust formula as required"))
B4:C4B4=B2+B3
G8:G11,C8:C11,K8:K9K8=J8-N(J7)
E10E10=50000-MIN(B2,50000)
E11E11=150000-MIN(150000,B2)
 
Upvote 0
Hi Kirk & Dave!

Thank you both so much for helping with this problem. I'm just reviewing your suggestions now and will report back.

Dave, all the calculations i have provided are the correct UK tax calculations :) I can check the spreadsheets for accuracy manually.

Kind regards

Mike
 
Upvote 0
Hi Kirk & Dave

I've tested both of your spreadsheets and neither work for all scenarios - although Dave's seems to be more accurate (to a point). I'm going to post Feedback for both in a moment.

Also, i am posting the manual "test" examples to show what the right answers should be.

Regards

Mike
 
Upvote 0
200417 MR EXCEL SUPPORT.xlsx
ABCDEFGHIJKLMNOPQRSTU
1IncomeTax Due
2Wages £ 12,500 £ - TEST 10%20%40%
3Dividends £ 200,000 £ 58,975.00 £ 12,500 £ 50,000 £ 150,000
4 £ 212,500 £ 58,975.00 Wages £ 30,000 £ - £ 3,500.00 £ - ok
5
6Regular IncomeDividend Income0.0%7.5%32.5%38.1%
7BracketsRatesRate DiffBracketsRatesRate DiffDividends £ 2,000 £ 50,000 £ 150,000 £ 1,000,000
8 £ - 0%0.00% £ - 0.0%0.0%Dividends £ 2,000 £ - £ - £ - £ - £ - ok
9 £ 12,500 20%20.00% £ 2,000 7.5%7.5%Dividends £ 50,000 £ - £ 1,350.00 £ 9,750.00 £ - £ 11,100.00 ok
10 £ 50,000 40%20.00% £ 37,500 32.5%25.0%Dividends £ 100,000 £ - £ 1,350.00 £ 26,000.00 £ - £ 27,350.00 ok
11 £ 150,000 45%5.00% £ 137,500 38.1%5.6%Dividends £ 200,000 £ - £ 1,350.00 £ 32,500.00 £ 30,480 £ 64,330.00 ok
12 £ 1,000,000 38.1%0.0%
13TEST 20%20%40%
14 £ 12,500 £ 50,000 £ 150,000
15Wages £ 100,000 £ - £ 7,500.00 £ 20,000.00 £ 27,500.00 ok
16
170.0%7.5%32.5%38.1%
18Dividends £ 2,000 £ 50,000 £ 150,000 £ 1,000,000 ERROR RESULTS
19Dividends £ 2,000 £ - £ - £ - £ - £ - nok £ 500.00
20Dividends £ 50,000 £ - £ - £ 16,250.00 £ - £ 16,250.00 nok £ 16,100.00
21Dividends £ 100,000 £ - £ - £ 16,250.00 £ 19,050 £ 35,300.00 nok £ 35,150.00
22Dividends £ 200,000 £ - £ - £ 16,250.00 £ 57,150 £ 73,400.00 nok £ 73,250.00
23
24TEST 30%20%40%45%
25 £ 12,500 £ 50,000 £ 150,000 £ 1,000,000
26Wages £ 200,000 £ - £ 7,500.00 £ 40,000.00 £ 22,500.00 £ 70,000.00 ok
27
280.0%7.5%32.5%38.1%
29Dividends £ 2,000 £ 50,000 £ 150,000 £ 1,000,000
30Dividends £ 2,000 £ - £ - £ - £ - £ - nok £ 612.00
31Dividends £ 50,000 £ - £ - £ - £ 19,050 £ 19,050.00 nok £ 18,900.00
32Dividends £ 100,000 £ - £ - £ - £ 38,100 £ 38,100.00 nok £ 37,950.00
33Dividends £ 200,000 £ - £ - £ - £ 76,200 £ 76,200.00 nok £ 76,050.00
34
35TEST 40%20%40%
36 £ 12,500 £ 50,000 £ 150,000
37Wages £ 12,500 £ - £ - £ - £ - ok
38
390.0%7.5%32.5%38.1%
40Dividends £ 2,000 £ 50,000 £ 150,000 £ 1,000,000
41Dividends £ 2,000 £ - £ - £ - £ - £ - ok
42Dividends £ 50,000 £ - £ 2,662.50 £ 4,062.50 £ - £ 6,725.00 ok
43Dividends £ 100,000 £ - £ 2,662.50 £ 20,312.50 £ - £ 22,975.00 ok
44Dividends £ 200,000 £ - £ 2,662.50 £ 32,500.00 £ 23,813 £ 58,975.00 ok
45
DAVE
Cell Formulas
RangeFormula
C2C2=SUMPRODUCT(--(B2>A8:A11),B2-A8:A11,C8:C11)
C3C3=SUMPRODUCT(--(B3>rB),B3-rB,rDiff)
B4:C4B4=B2+B3
C8:C11,G8:G12C8=B8-N(B7)
E10E10=50000-MIN(B2,50000)
E11E11=150000-MIN(150000,B2)
R8:R11,R41:R44,R37,R30:R33,R26,R19:R22,R15R8=SUM(N8:Q8)
 
Upvote 0
Hi Dave. For a weird reason, your version works well until i did the "test numbers". When there is a high wages figure eg £100,000, the 0% dividends end up with £500 tax applied (when it should be zero), then each calculation of dividend tax after that is out consistently by a set number eg £150 when wages = £100,000? And the pattern repeats as you can see in the other tests. Why is that?

Please see my manual calculations t show how the correct tax has been calculated.

Thanks again for your help with this - you've got a lot further than i did!

Kind regards

Mike
 
Upvote 0

Forum statistics

Threads
1,215,327
Messages
6,124,287
Members
449,149
Latest member
mwdbActuary

We've detected that you are using an adblocker.

We have a great community of people providing Excel help here, but the hosting costs are enormous. You can help keep this site running by allowing ads on MrExcel.com.
Allow Ads at MrExcel

Which adblocker are you using?

Disable AdBlock

Follow these easy steps to disable AdBlock

1)Click on the icon in the browser’s toolbar.
2)Click on the icon in the browser’s toolbar.
2)Click on the "Pause on this site" option.
Go back

Disable AdBlock Plus

Follow these easy steps to disable AdBlock Plus

1)Click on the icon in the browser’s toolbar.
2)Click on the toggle to disable it for "mrexcel.com".
Go back

Disable uBlock Origin

Follow these easy steps to disable uBlock Origin

1)Click on the icon in the browser’s toolbar.
2)Click on the "Power" button.
3)Click on the "Refresh" button.
Go back

Disable uBlock

Follow these easy steps to disable uBlock

1)Click on the icon in the browser’s toolbar.
2)Click on the "Power" button.
3)Click on the "Refresh" button.
Go back
Back
Top