Help with charts

CivilPengineer

New Member
Joined
Feb 20, 2012
Messages
12
I want to use the charts to do the following:
I have data where each data point has an "X" value, "Y" value (co-ordinates) and a "UR" value. These are in three columns, each data point is on a seperate row. Here is some dummy data (real data is a lot bigger):

156qtyf.jpg


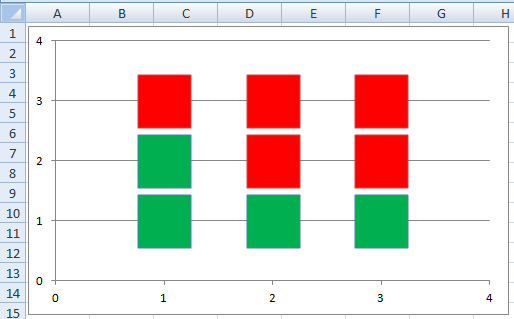
What I want to do is make a chart where it shows the location of each data point in X,Y, and then colours the point green if the "UR" value for that point is less than or equal to 1, and red if it is greater than 1.

It will look something like this (although I had imagined using a chart to do this, not cells in the workbook)

2cpuwjk.jpg


Can anyone help? I was thinking I might be able to do something with the 3d surface chart but I can't get it to work.

Any ideas much appreciated!
 

Excel Facts

Will the fill handle fill 1, 2, 3?
Yes! Type 1 in a cell. Hold down Ctrl while you drag the fill handle.
Hi Civil P Engineer.

Welcome to the forums!

Here is my draft of what you are trying to do.

It is not in 3d, is that okay?

XYConditionalScatterDots.png
 
Upvote 0
That looks fine, how did you do that? Assuming that can be extended to automatically read hundreds of lines of data and make a much bigger chart, that will be perfect :)

Thanks!
 
Upvote 0
It's a plot of various node points on a wall within a building. For each point I have other calculations determining whether the building structure is strong enough at that point, which is represented by the UR value. If UR <1, the structure is OK at that point, if UR >1, the structure is not OK at that point.

Can you let me know how you made the chart? I'm off home now but I'm excited to try it out on some of my real data :biggrin:

Thanks for your help
Luke
 
Upvote 0
This is fantastic! I have followed your excellent youtube video, first to replicate what you did with the sample data, then extended it to my real data. The results can be see below:

2cxxctz.jpg


Turns out the real data points aren't quite so regularly arranged as my imaginary sample data, so I swapped to diamonds to reduce overlapping. But this is great, it shows a good visual representation of the wall and highlights the area of concern at the bottom right really clearly. Much better than searching through 900+ lines of data for the URs >1. I'm very happy with this!

Thanks a lot for your help, and for making such a clear and instructive video. I will share it around my office as I'm sure a lot of my colleagues will find this useful.

Again, many thanks! :)

Luke
 
Upvote 0
I luke, i was thinking about your new post where you stated that there are overlapping points.

One fix for this is to move your RED data UP to the top in the Select Data Dialog Box. That way it will show on top of the chart and then RED will always be on top.

Thanks again for your very kind comments!
 
Upvote 0
Hi Steve
I even took it a bit further and made various colours for different ranges of UR. Here blue describes the range 0 < x < 0.25, green up to 0.5, yellow up to 0.75, orange up to 1, and red for x > 1.<ur<=0.25, green="" describes="" 0.25<ur<="0.5," yellow="" is="" 0.5<ur<="0.75" and="" orange="" 0.75<ur<="1." red="" still="" ur=""> In case you're wondering why the red points aren't the same as before, this is a different set of data to the one I posted before (other face of the wall).

xgk7lx.jpg


This gives a better idea of the stressed areas in the wall (more stress = higher UR) and gives something meaningful to examine for other walls where no UR is greater than 1.

Thanks for the tip about the order, I will arrange it so that red is on top, then orange, yellow etc.

Thanks again for the help :)

Luke</ur<=0.25,>
 
Last edited:
Upvote 0

Forum statistics

Threads
1,215,069
Messages
6,122,959
Members
449,096
Latest member
Anshu121

We've detected that you are using an adblocker.

We have a great community of people providing Excel help here, but the hosting costs are enormous. You can help keep this site running by allowing ads on MrExcel.com.
Allow Ads at MrExcel

Which adblocker are you using?

Disable AdBlock

Follow these easy steps to disable AdBlock

1)Click on the icon in the browser’s toolbar.
2)Click on the icon in the browser’s toolbar.
2)Click on the "Pause on this site" option.
Go back

Disable AdBlock Plus

Follow these easy steps to disable AdBlock Plus

1)Click on the icon in the browser’s toolbar.
2)Click on the toggle to disable it for "mrexcel.com".
Go back

Disable uBlock Origin

Follow these easy steps to disable uBlock Origin

1)Click on the icon in the browser’s toolbar.
2)Click on the "Power" button.
3)Click on the "Refresh" button.
Go back

Disable uBlock

Follow these easy steps to disable uBlock

1)Click on the icon in the browser’s toolbar.
2)Click on the "Power" button.
3)Click on the "Refresh" button.
Go back
Back
Top