Help with pivot table or other solution

rawr19911

Board Regular
Joined
Jan 21, 2020
Messages
88
Office Version
  1. 2016
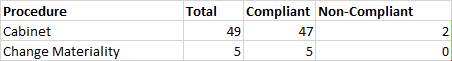
So i am trying to make a pivot table that i can create graphs and other reporting off of-- what i need is the first column listed out ( there are more then jus the 2 shown) and the second column to show a number so what i want is it to report like this
1681915556955.png
the total can be on the right side if needed. reason i wanted to do this is so management can drop the data in and copy and paste the results in a email
1681915468292.png
 

Attachments

  • 1681915534768.png
    1681915534768.png
    3.5 KB · Views: 4

Excel Facts

Return population for a City
If you have a list of cities in A2:A100, use Data, Geography. Then =A2.Population and copy down.

Forum statistics

Threads
1,215,045
Messages
6,122,840
Members
449,096
Latest member
Erald

We've detected that you are using an adblocker.

We have a great community of people providing Excel help here, but the hosting costs are enormous. You can help keep this site running by allowing ads on MrExcel.com.
Allow Ads at MrExcel

Which adblocker are you using?

Disable AdBlock

Follow these easy steps to disable AdBlock

1)Click on the icon in the browser’s toolbar.
2)Click on the icon in the browser’s toolbar.
2)Click on the "Pause on this site" option.
Go back

Disable AdBlock Plus

Follow these easy steps to disable AdBlock Plus

1)Click on the icon in the browser’s toolbar.
2)Click on the toggle to disable it for "mrexcel.com".
Go back

Disable uBlock Origin

Follow these easy steps to disable uBlock Origin

1)Click on the icon in the browser’s toolbar.
2)Click on the "Power" button.
3)Click on the "Refresh" button.
Go back

Disable uBlock

Follow these easy steps to disable uBlock

1)Click on the icon in the browser’s toolbar.
2)Click on the "Power" button.
3)Click on the "Refresh" button.
Go back
Back
Top