How would I create this column chart in Excel?

JakeSwe

New Member
Joined
Jun 19, 2012
Messages
13
Hi!

Probably a very simple question but I want to create a double column chart in Excel such as this one.

example.png


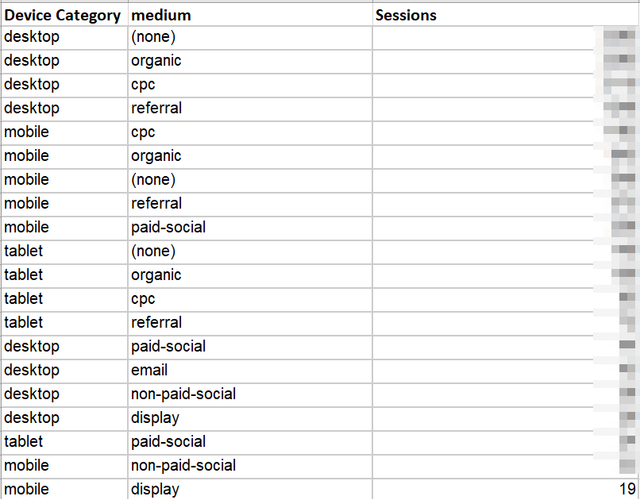
I have been playing around a lot but I just haven't been able to figure out how to set it up. For example, is this the right starting point?

Book1_Excel_2018_03_25_11_33_41.png


Any help would be very much appreciated!

Thanks a lot in advance :)
 

Excel Facts

Enter current date or time
Ctrl+: enters current time. Ctrl+; enters current date. Use Ctrl+: Ctrl+; Enter for current date & time.
Try this.

MediumDesktop
Mobile
Paid43.00%42.50%
Organic18.00%24.00%
Direct13.50%14.00%
Social13.00%3.00%
Email8.00%12.00%
Referral3.00%4.00%

<tbody>
</tbody>
 
Upvote 0

Forum statistics

Threads
1,216,153
Messages
6,129,176
Members
449,491
Latest member
maxim_sivakon

We've detected that you are using an adblocker.

We have a great community of people providing Excel help here, but the hosting costs are enormous. You can help keep this site running by allowing ads on MrExcel.com.
Allow Ads at MrExcel

Which adblocker are you using?

Disable AdBlock

Follow these easy steps to disable AdBlock

1)Click on the icon in the browser’s toolbar.
2)Click on the icon in the browser’s toolbar.
2)Click on the "Pause on this site" option.
Go back

Disable AdBlock Plus

Follow these easy steps to disable AdBlock Plus

1)Click on the icon in the browser’s toolbar.
2)Click on the toggle to disable it for "mrexcel.com".
Go back

Disable uBlock Origin

Follow these easy steps to disable uBlock Origin

1)Click on the icon in the browser’s toolbar.
2)Click on the "Power" button.
3)Click on the "Refresh" button.
Go back

Disable uBlock

Follow these easy steps to disable uBlock

1)Click on the icon in the browser’s toolbar.
2)Click on the "Power" button.
3)Click on the "Refresh" button.
Go back
Back
Top