I need a variance visual like this

rolito

New Member
Joined
Jun 14, 2007
Messages
14
Hello,

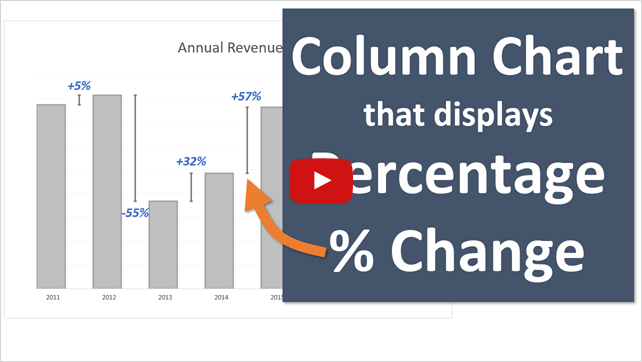
I need to build a variance chart like this one:

1579025456963.png


Blue bar: Forecast
Orange bar: Actual
Avobe bars: %variance

I have been looking PBI visuals (and custom visuals too in market) but I can´t find something as simple as this one!

I would apprecitate your help

Thanks
 

Excel Facts

How to find 2nd largest value in a column?
MAX finds the largest value. =LARGE(A:A,2) will find the second largest. =SMALL(A:A,3) will find the third smallest
Sorry, but that solution is for Excel.

I need it for Power BI (thats why I posted on this Power BI forum ;))
 
Upvote 0

Forum statistics

Threads
1,215,487
Messages
6,125,085
Members
449,206
Latest member
ralemanygarcia

We've detected that you are using an adblocker.

We have a great community of people providing Excel help here, but the hosting costs are enormous. You can help keep this site running by allowing ads on MrExcel.com.
Allow Ads at MrExcel

Which adblocker are you using?

Disable AdBlock

Follow these easy steps to disable AdBlock

1)Click on the icon in the browser’s toolbar.
2)Click on the icon in the browser’s toolbar.
2)Click on the "Pause on this site" option.
Go back

Disable AdBlock Plus

Follow these easy steps to disable AdBlock Plus

1)Click on the icon in the browser’s toolbar.
2)Click on the toggle to disable it for "mrexcel.com".
Go back

Disable uBlock Origin

Follow these easy steps to disable uBlock Origin

1)Click on the icon in the browser’s toolbar.
2)Click on the "Power" button.
3)Click on the "Refresh" button.
Go back

Disable uBlock

Follow these easy steps to disable uBlock

1)Click on the icon in the browser’s toolbar.
2)Click on the "Power" button.
3)Click on the "Refresh" button.
Go back
Back
Top