LRATOZ
Board Regular
- Joined
- Aug 17, 2014
- Messages
- 59
- Office Version
- 2016
- Platform
- Windows
Hi,
I am making an application that makes up a 360 degree skyline of a site in Excel 2010.
If the site is reasonably flat I will get away with about 10 to 15 values (Azimuth and Elevation of objects in degrees).
On sites where there are lots of buildings, masts, trees, etc. it can go up to 150 or more data points for a 360 degree view.
The data is coming from a theodolite and the values are stored as a text file in two columns; Azimuth and elevation in degrees.
Now the problem is that I want to have a scale in the X-axis from 0 to 360 degrees.
When I import the data in a graph that only has, say 50 values, then the X-axis will only be showing 50 points.
I want to see the X-axis at the same scale all the time divided in 360 degrees.
Example:
I've got three points as follows:
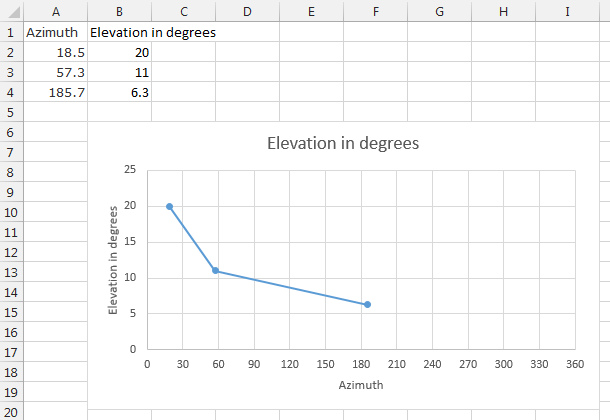
Azimuth Elevation in degrees
18.5 20
57.3 11
185.7 6.3
So I want to see these points marked on the X-axis at the corresponding dot in the X-axis.
So the 18.5 value should be at 18 degrees on the X-axis
The 57.3 value should be at 57 degrees on the X-axis
The 185.7 degrees should be on the 185 degrees point on the X-axis
All values in between should be 0 or equal to a base line.
I've been pulling out hair for days to sort this problem . Is there anybody out there who can help?
Thanks,
Luc
I am making an application that makes up a 360 degree skyline of a site in Excel 2010.
If the site is reasonably flat I will get away with about 10 to 15 values (Azimuth and Elevation of objects in degrees).
On sites where there are lots of buildings, masts, trees, etc. it can go up to 150 or more data points for a 360 degree view.
The data is coming from a theodolite and the values are stored as a text file in two columns; Azimuth and elevation in degrees.
Now the problem is that I want to have a scale in the X-axis from 0 to 360 degrees.
When I import the data in a graph that only has, say 50 values, then the X-axis will only be showing 50 points.
I want to see the X-axis at the same scale all the time divided in 360 degrees.
Example:
I've got three points as follows:
Azimuth Elevation in degrees
18.5 20
57.3 11
185.7 6.3
So I want to see these points marked on the X-axis at the corresponding dot in the X-axis.
So the 18.5 value should be at 18 degrees on the X-axis
The 57.3 value should be at 57 degrees on the X-axis
The 185.7 degrees should be on the 185 degrees point on the X-axis
All values in between should be 0 or equal to a base line.
I've been pulling out hair for days to sort this problem
. Is there anybody out there who can help?Thanks,
Luc