I have a data showing 4 variables that i would like to plot on a single graph.
Time: X axis (in 5 second intervals)
Temperature: Y axis.
I would like to plot
Target
Min
Max
Peak
The first 3 data sets look like this.
<colgroup><col><col><col></colgroup><tbody>
</tbody>
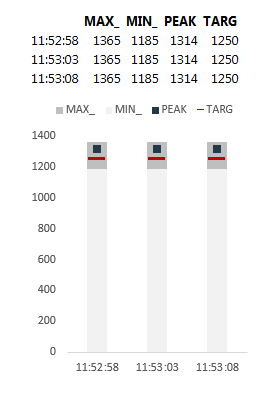
is this possible in excel?
Maybe i need to reorganize my data?
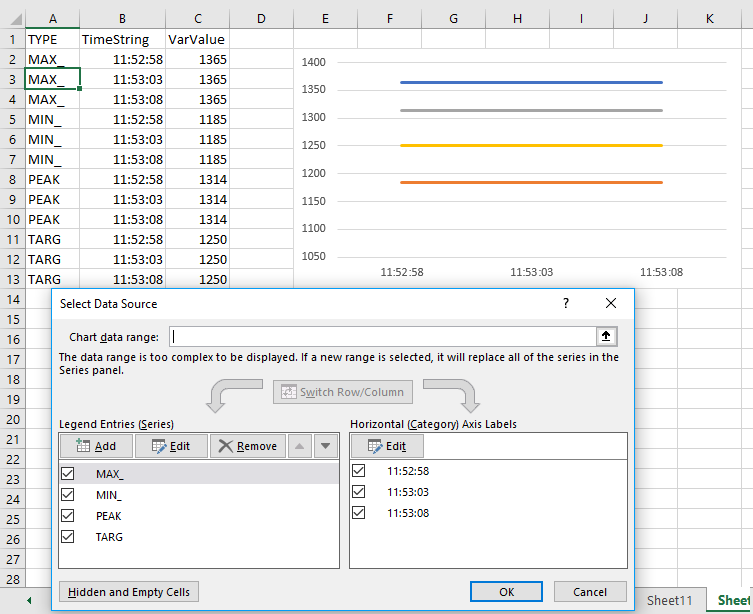
Time: X axis (in 5 second intervals)
Temperature: Y axis.
I would like to plot
Target
Min
Max
Peak
The first 3 data sets look like this.
| TYPE | TimeString | VarValue |
| MAX_ | 11:52:58 | 1365 |
| MIN_ | 11:52:58 | 1185 |
| PEAK | 11:52:58 | 1314 |
| TARG | 11:52:58 | 1250 |
| MAX_ | 11:53:03 | 1365 |
| MIN_ | 11:53:03 | 1185 |
| PEAK | 11:53:03 | 1314 |
| TARG | 11:53:03 | 1250 |
| MAX_ | 11:53:08 | 1365 |
| MIN_ | 11:53:08 | 1185 |
| PEAK | 11:53:08 | 1314 |
| TARG | 11:53:08 | 1250 |
<colgroup><col><col><col></colgroup><tbody>
</tbody>
is this possible in excel?
Maybe i need to reorganize my data?