Macro to move chart data series reference down one row for all charts and all series in workbook.

Taskmasterbob

New Member
Joined
Feb 5, 2021
Messages
1
Office Version
  1. 2016
Platform
  1. Windows
Hi guys

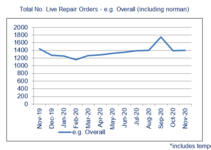
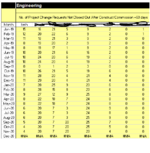
I have a number of line charts, some with one series some with multiple. There are around 70 of these charts which plot a variable over the past year from table on another worksheet. The table has months down the columns with a value for each location of the variable. See attached. Just a table.

Each month we add another row for the current month to these tables and we need to update the graph series to include this month. Basically moving the series references down one row in the spreadsheet. Ie from Jan to jan to feb to feb. this is done manually. This is so we can have a trend of the past 12 months of the variable at each location. Across the 70 or so graphs there are around 250 series to update. As you can imagine this is a bit of an task to update each series manually and move the reference down one row in the table.

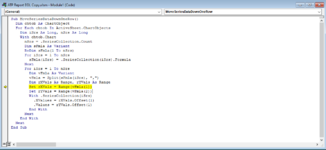
For example series values =Data!$DN$79:$DN$91 would become =Data!$DN$80:$DN$92

Is there a macro which I can use to move the reference down one row and run through all charts and series on the charts?

Thanks for the help.

Also asked here Macro to move series reference down one row for all charts.
 

Attachments

  • capture example chart.PNG
    capture example chart.PNG
    14.7 KB · Views: 35
  • Capture- example.PNG
    Capture- example.PNG
    19.5 KB · Views: 37
Last edited by a moderator:

Excel Facts

Copy a format multiple times
Select a formatted range. Double-click the Format Painter (left side of Home tab). You can paste formatting multiple times. Esc to stop
Firstly, Hi Dave,

Many thanks for looking at this for me. Sorry I didn't add my example.

Secondly, Hi Jon,

My thanks to you as well. Unfortunately I'm getting an error on this line:

ReDim sFmla(1 To nSrs)

Any thoughts? I do appreciate both of you looking at this and spending your time.

Cheers,
Simon
 
Upvote 0
What's the error?
Make sure sFmla and nSrs are declared properly.
Also make sure there is at least one series plotted in the chart.
 
Upvote 0
Hi guys,

I have found this topic and it has been of great help to me because it's exactly what I needed.

I happen to have a problem with the VBA code and would like to be able to get some help. I added the macro to my excel on friday. Everything worked perfectly and I was able to shift my graphics data one row down or up. I came back on the document this morning and i got a ''Run Time Error 1004''. I understand from reading online that the problem comes from the fact that my graphics are not on the same sheet as my data. However, it worked perfectly fine 3 days ago so I do not understand why it does not work anymore.

I joined the images of the error line and where it shows up in the code

Thank you so much!
 

Attachments

  • Code error.PNG
    Code error.PNG
    32.3 KB · Views: 8
  • Error 1004.PNG
    Error 1004.PNG
    4 KB · Views: 7
Upvote 0
What is the SERIES formula? Usually it looks like this:

Excel Formula:
=SERIES(Sheet3!$C$2,Sheet3!$B$3:$B$8,Sheet3!$C$3:$C$8,1)

However, sometimes it might look like this, without X values:

Excel Formula:
=SERIES(Sheet3!$C$2,,Sheet3!$C$3:$C$8,1)

Or it might look like one of these, with X and/or Y values hard coded rather than linked to cells:

Excel Formula:
=SERIES(Sheet3!$C$2,{"a";"b";"c";"d";"e";"f"},Sheet3!$C$3:$C$8,1)
=SERIES(Sheet3!$C$2,Sheet3!$B$3:$B$8,{3;6;4;7;5;8},1)

Missing or hard-coded values will cause the Range(Address) statement to fail.
 
Upvote 0
I'm trying to use Jon's code but I also want to move down the Name element of the chart series. Here's my modified code:

VBA Code:
Sub MoveSeriesDataDownOneRow()
  Dim chtob As ChartObject
  For Each chtob In ActiveSheet.ChartObjects
    Dim iSrs As Long, nSrs As Long
    With chtob.Chart
      nSrs = .SeriesCollection.Count
      Dim sFmla As Variant
      ReDim sFmla(1 To nSrs)
      For iSrs = 1 To nSrs
        sFmla(iSrs) = .SeriesCollection(iSrs).Formula
      Next
      For iSrs = 1 To nSrs
        Dim vFmla As Variant
        vFmla = Split(sFmla(iSrs), ",")
        Dim rXVals As Range, rYVals As Range, sName As String, rName As Range, vName As Variant
        sName = vFmla(0)
        sName = Mid(sName, Application.WorksheetFunction.Find("(", sName) + 1, Len(sName) - (Application.WorksheetFunction.Find("(", sName)))
        Set rName = Range(sName)
'       Set rXVals = Range(vFmla(1))
        Set rYVals = Range(vFmla(2))
        With .SeriesCollection(iSrs)
'            .Name = rName.Offset(1)
'            .XValues = rXVals.Offset(1)
            .Values = rYVals.Offset(1)
        End With
      Next
    End With
  Next
End Sub

The variable sName seems to have the correct string that I want to convert to a range, however when I Set rName = Range(sName), rName displays the contents of the cell when I hover over it and it puts the cell contents into the series formula when I execute .Name = rName.Offset(1).

Any ideas as to why this is happening?

Thanks in advance for any feedback!
 
Upvote 0
This will apply the range to the series name, not just the value:

VBA Code:
.Name = "=" & rName.Offset(1).Address(, , , True)

It's a little inconsistent, but then, it's Excel VBA.
 
Upvote 0
This is a little more straightforward:

VBA Code:
Sub MoveSeriesDataDownOneRow()
  Dim chtob As ChartObject
  For Each chtob In ActiveSheet.ChartObjects
    Dim iSrs As Long, nSrs As Long
    With chtob.Chart
      nSrs = .SeriesCollection.Count
      Dim sFmla As Variant
      ReDim sFmla(1 To nSrs)
      For iSrs = 1 To nSrs
        sFmla(iSrs) = .SeriesCollection(iSrs).Formula
      Next
      For iSrs = 1 To nSrs
        Dim vFmla As Variant
        vFmla = Split(sFmla(iSrs), ",")
        Dim rXVals As Range, rYVals As Range
        Set rXVals = Range(vFmla(1))
        Set rYVals = Range(vFmla(2))
        With .SeriesCollection(iSrs)
          .XValues = rXVals.Offset(1)
          .Values = rYVals.Offset(1)
        End With
      Next
    End With
  Next
End Sub
How can I change it to only move the reference areas of the active chart?
 
Upvote 0
You can remove a few lines.

VBA Code:
Sub MoveSeriesDataDownOneRow()
    Dim iSrs As Long, nSrs As Long
    With ActiveChart
      nSrs = .SeriesCollection.Count
      Dim sFmla As Variant
      ReDim sFmla(1 To nSrs)
      For iSrs = 1 To nSrs
        sFmla(iSrs) = .SeriesCollection(iSrs).Formula
      Next
      For iSrs = 1 To nSrs
        Dim vFmla As Variant
        vFmla = Split(sFmla(iSrs), ",")
        Dim rXVals As Range, rYVals As Range
        Set rXVals = Range(vFmla(1))
        Set rYVals = Range(vFmla(2))
        With .SeriesCollection(iSrs)
          .XValues = rXVals.Offset(1)
          .Values = rYVals.Offset(1)
        End With
      Next
    End With
End Sub
 
Upvote 0

Forum statistics

Threads
1,215,043
Messages
6,122,812
Members
449,095
Latest member
m_smith_solihull

We've detected that you are using an adblocker.

We have a great community of people providing Excel help here, but the hosting costs are enormous. You can help keep this site running by allowing ads on MrExcel.com.
Allow Ads at MrExcel

Which adblocker are you using?

Disable AdBlock

Follow these easy steps to disable AdBlock

1)Click on the icon in the browser’s toolbar.
2)Click on the icon in the browser’s toolbar.
2)Click on the "Pause on this site" option.
Go back

Disable AdBlock Plus

Follow these easy steps to disable AdBlock Plus

1)Click on the icon in the browser’s toolbar.
2)Click on the toggle to disable it for "mrexcel.com".
Go back

Disable uBlock Origin

Follow these easy steps to disable uBlock Origin

1)Click on the icon in the browser’s toolbar.
2)Click on the "Power" button.
3)Click on the "Refresh" button.
Go back

Disable uBlock

Follow these easy steps to disable uBlock

1)Click on the icon in the browser’s toolbar.
2)Click on the "Power" button.
3)Click on the "Refresh" button.
Go back
Back
Top