Pivot Chart Groups Display Vertical Separator

Grasor

Board Regular
Joined
May 16, 2014
Messages
123
Office Version
  1. 365
Platform
  1. Windows
Hello All,

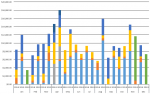
Been a stint since I was on the boards last but as usual we all find out way back here eventually. Today I was building a PivotTable with an accompanying PivotChart. The table is simple, it just groups Net Income by individual sources of income for each month by year. The PivotChart is a Stacked Bar Chart so all sources of income in a month are stacked on each other. The chart shows a column for each January first, then each February, etc. The problem is that it is difficult to clearly see where the "Januarys" end and the "Februarys" begin.

Attached is a snippet image of the chart.

How can I extend the lines on the horizontal axis to the top of the chart between each group of months?

Thanks as always.
G
 

Attachments

  • Capture.PNG
    Capture.PNG
    25.7 KB · Views: 33

Excel Facts

Which came first: VisiCalc or Lotus 1-2-3?
Dan Bricklin and Bob Frankston debuted VisiCalc in 1979 as a Visible Calculator. Lotus 1-2-3 debuted in the early 1980's, from Mitch Kapor.
Hello

In the example below, there are three data fields and five pivot items. This method works if all the month blocks have the same width.

vert.JPG


VBA Code:
Sub Grasor()
Dim pa As PlotArea, co As ChartObject, L As Shape, ax As Axis, _
pt As PivotTable, r As PivotField, un, i%
ActiveWindow.Zoom = 100
Set pt = Sheets("pivotsheet").PivotTables(1)
Set r = pt.RowFields(1)
Set co = ActiveSheet.ChartObjects("chart1")
With co.Chart
    Set ax = .Axes(xlCategory)
    Set pa = .PlotArea
End With
un = pa.InsideWidth / (r.PivotItems.Count * pt.DataFields.Count)
For i = 1 To r.PivotItems.Count - 1
    Set L = co.Chart.Shapes.AddLine(pa.InsideLeft + 3 * un * i, _
    pa.InsideTop, pa.InsideLeft + 3 * un * i, ax.Top)
    L.Line.ForeColor.RGB = RGB(100, 200, 10)
    L.Line.Weight = 2
Next
End Sub
 
Upvote 0
Worf,

Thanks! Will check this out and let you know if I need more assistance.

-G
 
Upvote 0

Forum statistics

Threads
1,215,523
Messages
6,125,318
Members
449,218
Latest member
Excel Master

We've detected that you are using an adblocker.

We have a great community of people providing Excel help here, but the hosting costs are enormous. You can help keep this site running by allowing ads on MrExcel.com.
Allow Ads at MrExcel

Which adblocker are you using?

Disable AdBlock

Follow these easy steps to disable AdBlock

1)Click on the icon in the browser’s toolbar.
2)Click on the icon in the browser’s toolbar.
2)Click on the "Pause on this site" option.
Go back

Disable AdBlock Plus

Follow these easy steps to disable AdBlock Plus

1)Click on the icon in the browser’s toolbar.
2)Click on the toggle to disable it for "mrexcel.com".
Go back

Disable uBlock Origin

Follow these easy steps to disable uBlock Origin

1)Click on the icon in the browser’s toolbar.
2)Click on the "Power" button.
3)Click on the "Refresh" button.
Go back

Disable uBlock

Follow these easy steps to disable uBlock

1)Click on the icon in the browser’s toolbar.
2)Click on the "Power" button.
3)Click on the "Refresh" button.
Go back
Back
Top