NewbytoPowerBI
New Member
- Joined
- Oct 6, 2021
- Messages
- 2
- Office Version
- 365
- Platform
- MacOS
- Web
I would be so grateful if anyone can help solve a problem I am having with Power BI.
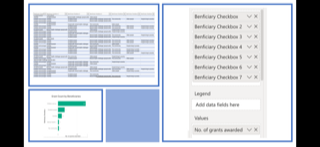
I work for a mental health and disability charity. On our application form, organisations can tick who will benefit from receiving the funds that they are applying for. They can tick up to 7 boxes, with some people ticking 1 or 2 boxes and others ticking all 7. I would like to show the total results for each beneficiary group e.g. Older people/disabled people/Families etc. in a clustered bar chart but currently my bar chart only seems to be counting the entries in tick box 1. The information from the tick boxes comes out of our database in one text stream which I then have to seperate in to seperate columns with box 1, 2, 3 etc. being different for each application depending on the order and number of things ticked by the applicant.
I am attaching an extract of the data and also a visual of how I have currently set things up in Power BI but as I mentioned, it is only currently counting the entries in choice 1 (the column that I have called beneficiary checkbox 1).
This visual forms part of a report which also shows other things so the tick box data needs to stay connected to the other data in the row so that it interacts with the grant value, geographical areas benefiting etc.
I hope this makes some sense, its difficult to explain what I mean but hopefully the pics attached will help.
Thanks in advance.
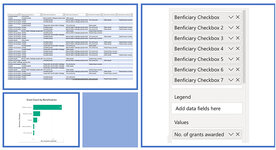