
Determine The Height And Width Of The Datalabel Object
April 30, 2021 - by Bill Jelen

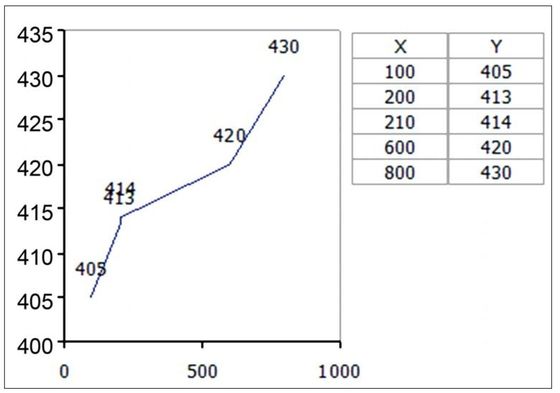
Challenge: The DataLabel object does not have either a height or width property, and Excel does not permit the user to resize a data label. In some situations, you may need to determine these properties. A case in point is a series with long, wrapping label text or labels of points that are very close to each other, where it is intended to programmatically adjust label position to get rid of any overlaps (Figure 85).
Background: The solution to this problem makes use of the fact that it is not possible to move a data label (or, for that matter, any movable chart element, such as a legend, a chart title, an axis title etc.) even partially off the chart area. To verify this, select a single data label with two single clicks and try dragging it off the chart through the bottom-right corner. You cannot drag it beyond the point where the bottom-right corners of the data label and the chart coincide.
Figure 86 illustrates the situation that prevails when the label is moved to the bottom-right corner of the chart area. The origin (0,0) for the chart coordinates is the top-left corner of the chart area.
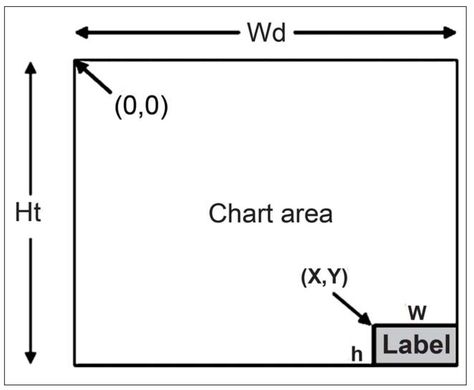
Using VBA, Wd =ChartArea.Width, Ht = ChartArea.Height
The values of x and y are obtained from the Top and Left properties of the DataLabel object.
The height and width of the label can be calculated as:
h = Ht – y
w = Wd – x
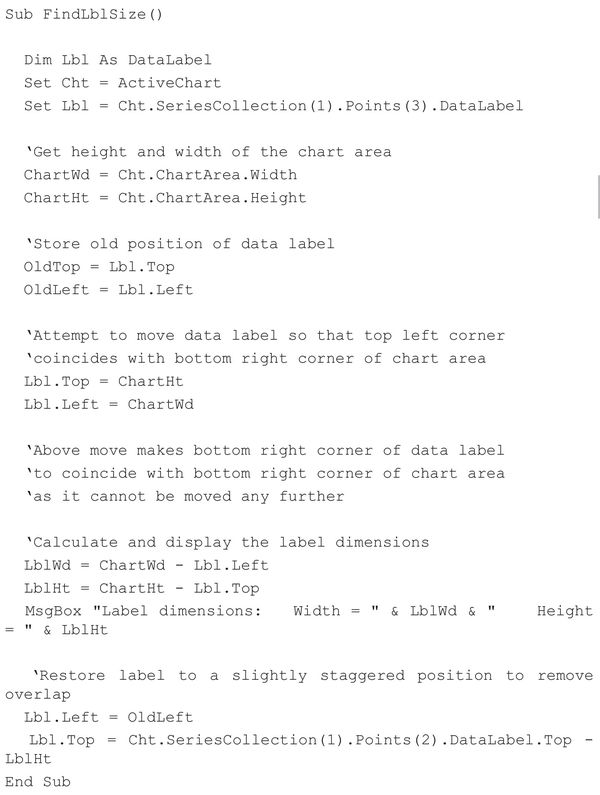
Solution: Ensure that the chart in question is the active chart and use the following code:
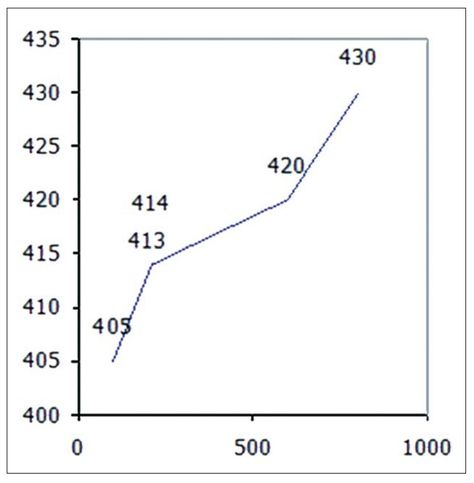
With the background discussed earlier, the comments in the code are self-explanatory. Figure 87 shows the chart after the label’s position has been adjusted
Summary: Excel restricts the movement of objects on a chart to within the chart boundaries in order to programmatically determine the height and width of a data label. By itself, the code in this solution is not of much use, but the technique illustrated could form the basis of a larger routine for programmatically examining a series for overlapping data labels and staggering them, if required.
Title Photo: Leo Foureaux on Unsplash
This article is an excerpt from Excel Gurus Gone Wild.