
Distinct Count
August 30, 2017 - by Bill Jelen

Excel Distinct Count or Unique Count. Pivot tables will offer a distinct count, if you check one tiny box as you create the pivot table.
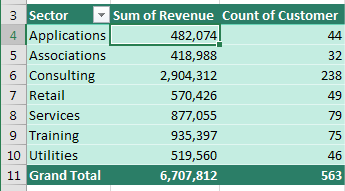
Here is an annoyance with pivot tables. Drag the Customer column from the Data table to the VALUES area. The field says Count of Customer, but it is really a count of how many invoices belong to each sector. What if you really want to see how many unique customers belong to each sector?
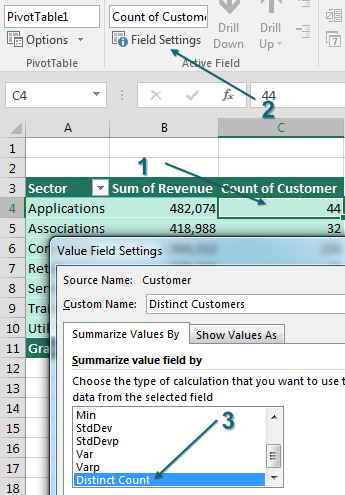
Select a cell in the Count of Customer column. Click Field Settings. At first, the Summarize Values By looks like the same Sum, Average, and Count that you’ve always had. But scroll down to the bottom. Because the pivot table is based on the Data Model, you now have Distinct Count.
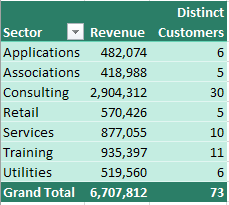
After you select Distinct Count, the pivot table shows a distinct count of customers for each sector. This was very hard to do in regular pivot tables.
Count Distinct in Excel 2010
To join two tables in Excel 2010, you have to download the free Power Pivot add-in from Microsoft. Once you have that installed, here are the extra steps to get your data into Power Pivot:
- Select a cell in the Data table. On the PowerPivot tab, choose Create Linked Table. If Excel leaves you in the PowerPivot grid, use Alt + Tab to get back to Excel.
- Select a cell in the Sectors table. Choose Create Linked Table.
- From either the PowerPivot tab in the Excel ribbon or the Home tab in the PowerPivot ribbon, choose to create a pivot table.
When it comes time to create relationships, you have only one button called Create. Excel 2010 will attempt to AutoDetect relationships first. In this simple example, it will get the relationship correct.
Thanks to Colin Michael and Alejandro Quiceno for suggesting Power Pivot in general.
Watch Video
- Introduced the Data Model in Podcast 2014 for Joining Tables
- Another Benefit is the ability to do Distinct Count
- Regular pivot table can not count customers per sector
- Add the data to the Data Model and you have Distinct Count available
- Before Excel 2013, you would have to add 1 / COUNTIF to the original data
Video Transcript
Learn Excel from MrExcel podcast, episode 2015 - Distinct Count!
Alright, all the tips in this book are going to be podcast, check out this playlist for the whole set!
OK, so today we have to create a report that shows how many customers are in each sector, and a regular Pivot table CANNOT do this. So Insert PivotTable will put sectors down the left-hand side, and then ask for the count of Customer, and it says it's giving us the count of Customer. But this isn't the count of Customer, this is how many records there are, alright, we don’t have 563 customers, completely, completely useless. But check this out, amazingly easy to solve this, yesterday's podcast we talked about using the Data Model to join 2 tables together. Today I just have one table, there's, you know, you wouldn't think there's any reason to use the data model, except for this, so choose the box “Add this data to the Data Model”.
By the way, this is brand new in Excel 2013, so you need 13 or 16, if you're stuck on a Mac or back in Excel 2010, I'll show you the old solution here at the end. Click OK, build the exact same report, sectors down the left-hand side, count of Customer, an exact same wrong answer, but here's the difference. When we come into Field Settings see, it looks the same, Sum, Count, Average, Max, Min, there's a few missing, and at the very bottom there's a new one called Distinct Count. Wow, that is something that has been so hard to do in old versions of Excel, in fact let me show you how we used to do it in Excel 2010.
So here's the data, you would have to come out and do a COUNTIF, count how many times Vertex42 appears in column D, and it appears there are 6 times. So then the Distinct Count is =1 divided by that, alright, see what we're doing, if there's six records with Vertex42, we're giving each of them 1/6 or 0.16611, and when we add all that up, that will get us to 1, right? There's 5 records here, each gets 1/5 or 20%, add all those up, each of those gets us to 1. So back in Excel 2010 or 7 or 3 or wherever you are, you don't have the Data Model, so you add those extra fields there, Sector, and then Distinct Count. This was so much more difficult than the new way, so I certainly appreciate the data model for this one. Well this tip, and a lot more in the book, click the “i” on the top-right hand corner, you can buy the book, $25 in print, $10 for an e-book, it's cheap!
In yesterday's podcast, 2014, we talked about the Data Model for joining tables, another benefit is the ability to do a distinct count. Regular Pivot table cannot count customers per sector, add the data to the Data Model, and you have Distinct Count available. Before Excel 2013, you do 1/COUNTIF in the original data, and of course, if you want to do distinct count for something else, you might have to change that formula, really, really frustrating. Beautiful, beautiful side benefit of the whole Power Pivot engine!
Download File
Download the sample file here: Podcast2015.xlsx
Title Photo: masch / pixabay