
Excel 2020: Another Way to Calculate Year-Over-Year
May 06, 2020 - by Bill Jelen

Instead of creating a formula outside of the pivot table, you can do this inside the pivot table.
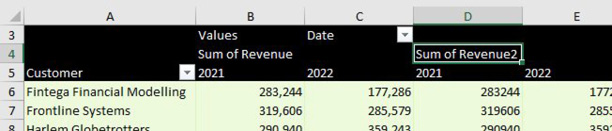
Start from the image with column D empty. Drag Revenue a second time to the Values area.
Look in the Columns section of the Pivot Table Fields panel. You will see a tile called Values that appears below Date. Drag that tile so it is below the Date field. Your pivot table should look like this:
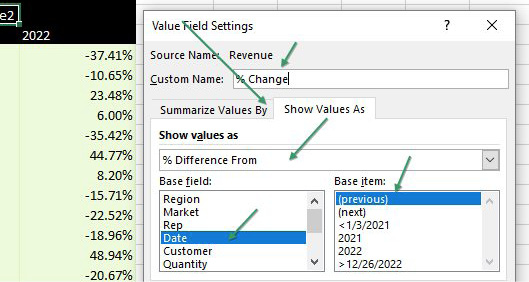
Double-click the Sum of Revenue2 heading in D4 to display the Value Field Settings dialog. Click on the tab for Show Values As.
Change the drop-down menu to % Difference From. Change the Base Field to Date. Change the Base Item to (Previous Item). Type a better name than Sum of Revenue2 - perhaps % Change. Click OK.
You will have a mostly blank column D (because the pivot table can't calculate a percentage change for the first year. Right-click the D and choose Hide.
Thanks to Tobias Ljung for this method.
Title Photo: Denys Nevozhai at Unsplash.com
This article is an excerpt from MrExcel 2020 - Seeing Excel Clearly.