Excel 2024: Replicate a Pivot Table for Each Rep


May 20, 2024 - by

Excel 2024: Replicate a Pivot Table for Each Rep

Here is a great trick I learned from southern California based Excel consultant Szilvia Juhasz.

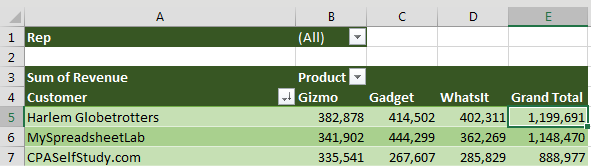
The pivot table below shows products across the top and customers down the side. The pivot table is sorted so the largest customers are at the top. The Sales Rep field is in the report filter.

This could be any pivot table, but the Rep field has been added to the Filter area.

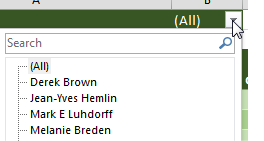
If you open the Rep dropdown, you can filter the data to any one sales rep.

The typical way to use the Filter field is to open the dropdown in B1 and choose a sales rep from the list.

This is a great way to create a report for each sales rep. Each report summarizes the revenue from a particular salesperson's customers, with the biggest customers at the top. And you get to see the split between the various products.


Here is the pivot table, now showing numbers for the selected sales rep.

Here is the pivot table, now showing numbers for the selected sales rep.

The Excel team has hidden a feature called Show Report Filter Pages. Select any pivot table that has a field in the report filter. Go to the Analyze tab. On the far left side is the large Options button. Next to the large Options button is a tiny dropdown arrow. Click this dropdown and choose Show Report Filter Pages.

But here is another way to use the Filter field. Change the drop-down in B1 back to (All). Then, look on the left side of the Analyze tab. There is an Options button. To the right of the Options button is a drop-down arrow. Open that and choose Show Report Filter Pages. The other two items in this menu are Options and Generate GetPivotData.


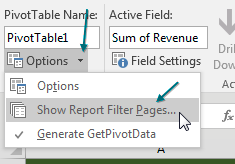
Excel asks which field you want to use. Select the one you want (in this case the only one available) and click OK.

This is the Show Report Filter Pages dialog. It says "Show All Report Filter Pages Of" and then gives you a list of all the fields in the Filter area. In the current case, there is only one field there - Rep. Choose that field and click OK.

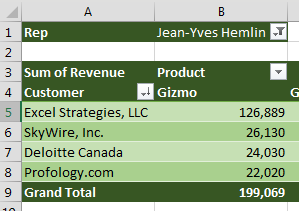
Over the next few seconds, Excel starts inserting new worksheets, one for each sales rep. Each sheet tab is named after the sales rep. Inside each worksheet, Excel replicates the pivot table but changes the name in the report filter to this sales rep.

The Show Report Filter Pages command has inserted many new worksheets to the left of the original pivot table. Each worksheet name has the next sales rep name as the sheet name. On each sheet, the Rep drop-down in B1 is showing the appropriate sales rep for that page.

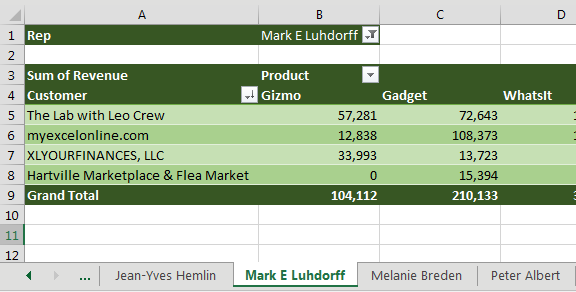
You end up with a report for each sales rep.

This would work with any field. If you want a report for each customer, product, vendor, or something else, add it to the report filter and use Show Report Filter Pages.

Thanks to Szilvia Juhasz for showing me this feature during a seminar I was teaching at the University of Akron many years ago. For the record, Szilvia was in row 1.


This article is an excerpt from MrExcel 2024 Igniting Excel

Title photo by Anastasiya Badun on Unsplash