
Pivot Table Median
May 02, 2018 - by Bill Jelen

This question comes up once every decade: Can you do a Median in a pivot table. Traditionally, the answer was No. I remember back in 2000 when I hired Excel MVP Juan Pablo Gonzalez to write an awesome macro that created reports that looked like pivot tables but had Medians.
So when Alex in my Houston Power Excel seminar asked about creating medians, I was quick to say "No". But then... I wondered if DAX had a median function. A quick Google search and Yes! There is a DAX function for Median.
What does it take to use DAX in a pivot table? You need the Windows version of Excel running Excel 2013 or newer.
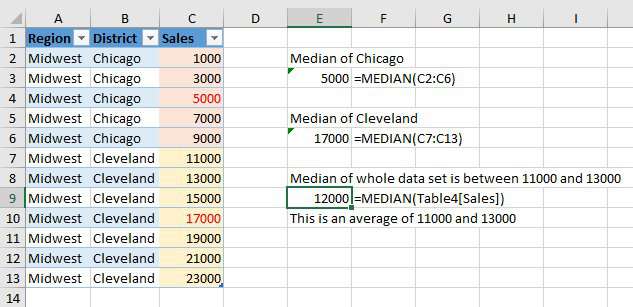
Here is my very simple data set that I will use to test how pivot table medians are calculated. You can see the median for Chicago should be 5000 and the median for Cleveland should be 17000. In the case of Chicago, there are five values, so the Median will be the 3rd highest value. But for the whole data set, there are 12 values. That means the median is somewhere between 11000 and 13000. Excel averages those two values to return 12000.
To begin, select one cell in your data and press Ctrl + T to format the data as a table.
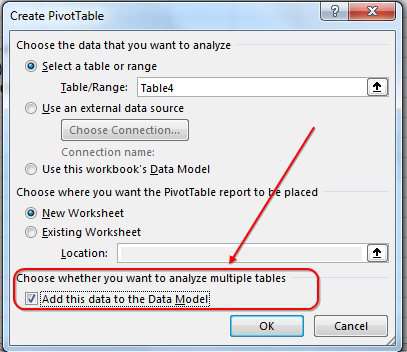
Then, choose Insert, Pivot Table. In the Insert PivotTable dialog, choose the box for Add This Data to the Data Model.
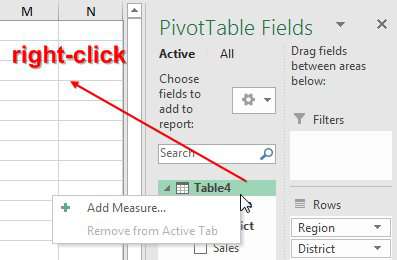
In the Pivot Table Fields, choose Region and District. But do not choose Sales. Instead, right-click on the Table heading and choose New Measure. "Measure" is a fancy name for a calculated field. Measures are more powerful than calculated fields in regular pivot tables.
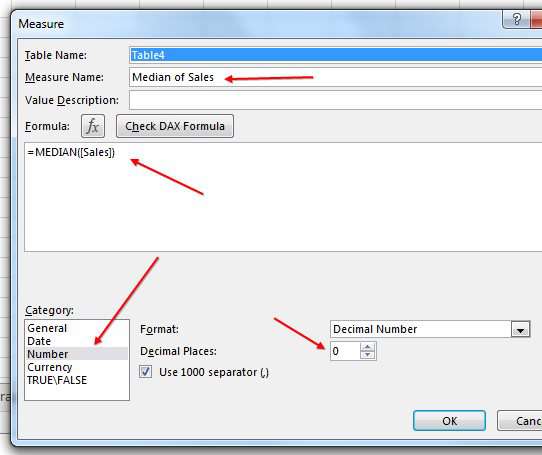
In the Define Measure dialog, fill out the four entries shown below:
- Measure Name: Median of Sales
-
Formula
=MEDIAN([Sales]) - Number format: Number
- Decimal Places: 0
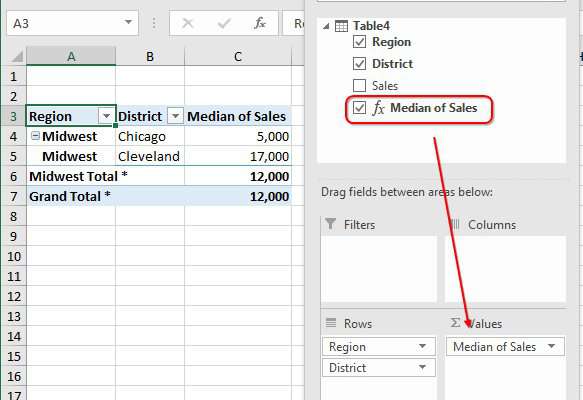
After creating the measure, it is added to the list of fields, but you have to choose the entry to add it to the Values area of the pivot table. As you can see below, the pivot table is correctly calculating the medians.
Watch Video
Video Transcript
Learn Excel from MrExcel Podcast, Episode 2197: Median in a Pivot Table.
I got to tell you, I'm hugely excited about this. when I was in Houston doing a Power Excel seminar there, and Alex raised his hand, said, "Hey, is there any way to do a median in a pivot table?" No, you can't do a median in a pivot table. I remember 25 years ago, my good friend, Juan Pablo Gonzales, actually brought a macro to do the equivalent of median, not using a pivot table-- it's just not possible.
But I had a spark. I said, "Wait a second,” and I open a browser, and I search for "DAX median", and, sure enough, there's a MEDIAN function in DAX, which means that we can solve this problem.
Alright, so, in order to use DAX, you have to be in Excel 2013 or Excel 2016, or in Excel 2010, and have the Power Pivot add-in; you don't have to have the Power Pivot tab, we just have to have the Data Model. Alright? So I'm going to choose this data, I'm going to make it into a table with Ctrl+T, and they give it an unimaginative name of "Table 4". In your case, it might be "Table 1". And we'll insert a Pivot Table, add this data to the Data Model, click OK, and we're going to choose Regional on the left hand side, but not Sales. Instead, I want to create a new calculated measurement. So I come up here to the table and I right-click and say, Add Measure. And this measure is going to be called "Median of Sales", and the formula's going to be: =MEDIAN. Press tab there and choose Sales, closing parenthesis. I can choose this as a number with zero decimal places, use a thousand separator and click OK. And, let's see, our new field is added here, we have to check-mark it to add it, and it says the median for Midwest is 12,000.
Now let's check that. So, here, all of Midwest, the median of the whole data sets between 11,000 and 13,000. So it's averaging 11 and 13, which is exactly what median would do in regular Excel. Now let's add district in and it says the median of Chicago's 5,000, the median of Cleveland is 17,000; Midwest total and grand total 12,000. All of that is correct. How awesome is that? Finally, median in a pivot table, thanks to a calculated field, or measure, as it's called, and the Data Model.
Now, many of my favorite tips-- the tips for my live Power Excel seminar-- in this book MrExcel LIVe, The 54 Greatest Tips of All Time. Click that "I" in the top right-hand corner to read more about the book.
Alright. Wrap-up: Can you do a median in a pivot table? Oh no, yes, yes you can, thanks to the Data Model. You can create a median; Ctrl+T to make your data into a table; Insert Pivot Table; and check that box, Add this data to the Data Model; right-click the table name and choose new measure, and the measure will be =MEDIAN([Sales]). It's awesome.
Thanks to Alex for showing up in my seminar and asking that question, thanks to you for stopping by. I'll see you next time for another netcast from MrExcel.
Download Excel File
To download the excel file: pivot-table-median.xlsx
Title Photo: Dan Gold / Unsplash