
Random Walk Down Wall Street
September 26, 2017 - by Bill Jelen

A simple gambling game is called Penny Pitching. Learn how Excel can model a career of penny pitching or a career of investing.
Note
If you took a class on financial modeling in college, you likely used a textbook written by Professor Simon Benninga. I met Simon twice, when we were judges for the ModelOff World Financial Modeling Championships. He truly enjoyed what he was doing and showed me this cool Excel trick.
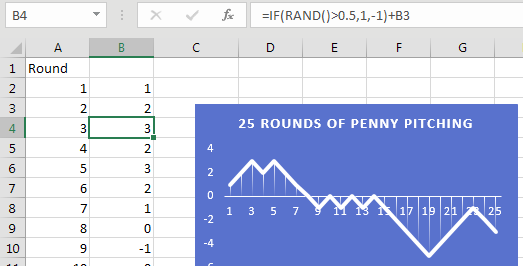
Simon Benninga tells a story of two illegal pastimes when he was attending private school in New York. The first was smoking in the bathroom. The second was a game called Penny Pitching. You and another student would each flip a penny. If you get one head and one tail, you win the penny. If the coins match (heads/heads or tails/tails), the other student gets the penny.
It is simple to model this game in Excel. If RAND()>.5, you win a penny. Otherwise, you lose a penny. Do that for 25 rows and chart the result. Press F9 to play 25 more rounds.
This is known as a Random Walk Down Wall Street. Simon would always point out a result like this one, where a hot young stock analyst is on fire with a series of wins, but then a series of losses wipe out the gain. This is why most investment prospectuses point out that past results are not a guarantee of future returns.
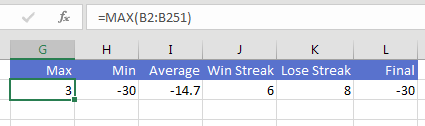
Instead of 25 trials, extend your table in A and B to run 250 trials. This would be like playing one round of penny pitching every work day for a year. Build a row of statistics about that year:
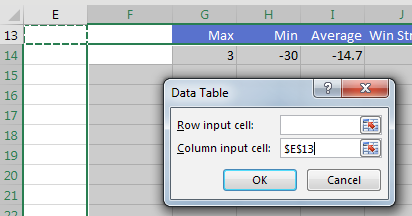
Create an odd data table where the blank cell in column F is the corner cell. Leave the Row Input Cell blank. Specify any blank cell as the Column Input Cell.
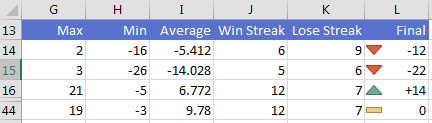
When you create the table, Excel will run the 250 coin flips once per row. This 30-row table models the entire career of a stock analyst. Every time you press F9, Excel runs the 250-row model for each of 30 years. You can watch an entire 30-year career be modeled with the simple press of F9.
Thanks to Professor Simon Benninga for showing me this technique. He had a chance to review this book just before he lost a battle to cancer in 2015. I trust he is in a better place - one where Pivot Tables don't default to Compact Form!
Watch Video
- Today's trick is from Professor Simon Benninga
- Game of penny-pitching. 50/50 chance that player A or player B doubles their money
- Play 25 rounds of penny-pitching in Excel
- Use =RAND()>.5 to find if you are up or down for the day
- Copy that formula to 25 rows and chart it
- Hot stock analyst might be up… but press F9
- Past results are not a guarantee of future returns
- Expand the worksheet to 250 rows to model a whole year
- Add statistics about that year
- The all-important corner cell will be blank
- The row input cell is blank
- The column input cell is any blank cell
- The resulting table models 30 years of results
Video Transcript
Learn Excel from MrExcel podcast, episode 2035 – Random Walk Down Wall Street!
Podcasting this entire book “MrExcel XL”, click the “i” on the top-right hand corner to get to the playlist!
Hey, welcome back to MrExcel netcast, I'm Bill Jelen. This trick today I got from Simon Benninga. If you took a finance class in college, you use Simon's book, it's the best-selling finance book about Excel there is. I met Simon at Model Off a couple years, what a great guy and he told this story about going to private school in New York, where there were two pastimes that were very popular and both illegal. First was smoking in the restroom, and then the second, the students would play a game called Penny Pitching. The way it works is two contestants, each take a penny, they each flip the penny, if it ends up heads/heads, or tails/tails, player A takes both pennies, otherwise player B takes both pennies. Said this was highly popular, and if the headmaster saw you, you know, you'd be in big trouble, but he would like to model that game, and you’re going to use a function here called RAND! I know I use RANDBETWEEN a lot, but RAND is kind of a more pure thing, it just returns values between 0 and 1. And so what we're going to do, because this is a 50-50 proposition, either you win both pennies or you lose both pennies, we're simply going to use the RAND function and check to see if it's >0.5 or not.
Alright, so the formula here, IF(RAND()>0.5 then we get a penny, otherwise we lose a penny, plus the results of the previous row. So this is a cumulative function, right, you can see whether you are up or down. Now in order to picture this, it's easy to take these cumulative results, create a nice little chart here. And so, you know, that the analogy is, this is a hot young stock analyst on Wall Street, who managed to put together a whole series of positive wins, and he says “Look like my past results! You know, I will take your money and get you a five-fold increase.” But what does Wall Street always say? The prospectus always says “You know, past results are not a guarantee of future results as well.” So press F9, and this hot young stock analyst who did great this year might lose all your money next year, you know, and up and down, right, so it's random, alright.
So, now the trick here, yesterday we used the data table with 12 input cells in one variable. Today, I'm going to take that Simon model, and I'm going to I'm going to increase it to 250 rows, right? So basically, 5 days a week * 50 weeks, so a whole work year, and then I create some statistics here: What's the highest number? What's the lowest number, how far down were we? What's the average? What's the longest win streak? What's the longest lose streak? And then, the all-important number is at the end of the year, are we up or are we down? Alright, so these 6 cells are modeling an entire year’s worth of results.
Alright, now yesterday we created a data table, where in the top-left hand corner cell was the all-important formula, this one's crazy, this has no formula in the data table. Alright, so we start here, and we'll go down 30 years, 30 rows, we're going to model 30 years, and it's really bizarre, the top-left corner cell is blank. We go into Data, What-If Analysis, Data Table, Row input cell, we're going to leave that blank. And then the Column input cell, check this out, because we have RAND over here, it can be any blank cell anywhere in the spreadsheet, just doesn’t matter, that one, that one, doesn't matter.
And when I click OK, they are going to take this entire year of penny pitching, and model it over and over and over again. Alright, so here's a 30-year career on Wall Street being modeled by a data table. For each one we can see what the longest streak was, the longest losing streak, you know, how far down, how far up, alright. And so this exact same model, that in that first chart looked like it was going to guarantee us future results, is all over the map. This was pretty cool. I have done the other data table, the one from yesterday's podcast, hundreds of times in my life, but I've never seen a data table with a blank corner cell. Of course, for this to work, you have to have RAND or RANDBETWEEN, but it is a great way to do maybe Monte Carlo simulation, or something where we want to just run random samples over and over and over again. And think about what's going to each row of this, somewhere in memory, it's running this model, 250 rows of this model, over and over and over. It's just a crazy amount of calculations that are happening here, so thanks to Simon.
You know, I pre-sold copies of this book, and one of the people who bought it was Simon, and Simon wrote to me in the final summer when I was working on the book, and he said “You know, hey Bill, things aren't going well here, they found cancer.” And he was just flat out, he said “I'm not going to make it.” And so I told Simon I was going to include this tip in the book, and he said “Oh, that would be great, I appreciate it!” Simon didn't get to see the book, I didn't make it until the book was out. So, thanks my friend Simon Benninga, who gave us this really, really cool trick. So, you know, keep Simon's memory alive, figure out a way to use the data table from that blank cell, and shout out to Simon for that tip. Hey, it's Friday, payday possibly for you, you can buy this entire book, with Simon's trick and many more tricks, $10 for the e-book, $25 for the print book.
Alright so, thanks to Simon! He used to play penny pitching, 50-50 chance that player A or player B doubles their money. You can place 25 rounds of penny pitching in Excel, and that hot young stock analyst who was up in the first year, press F9 and things can go completely down, so past results are not guarantee of future. So we took that, made 250-year rows to model a whole year here, added statistics about that year, and then the top-left corner cell, the data table would be blank. When we do Data, What-If Analysis, Data Table, that Row input cell is empty, we don't put anything in there, and then for the Column inputs cell we just point to any blank cell in the spreadsheet, and the resulting table models 30 years of results, just an amazing trick.
Well hey, I want to thank you for stopping by, we'll see you next time for another netcast from MrExcel!
Download File
Download the sample file here: Podcast2035.xlsx
Title Photo: Free-Photos / Pixabay