
Use Quick Insights
May 23, 2023 - by Bill Jelen

Don't Forget to Save Your File!
The File menu in Power BI Desktop does not have the word File on it. Open the dropdown where the File menu should be and save your work as a PBIX file.
Share Your Dashboard to Power BI in the Cloud
Click the Publish icon in Power BI Desktop. The report will be uploaded to your Power BI account.
Once your data has been published to the cloud, you can run Quick Insights. This feature is brand new in October 2016. It is based on algorithms from Microsoft Labs. It feels reminiscent of the Recommended Pivot Table feature introduced in Excel 2013. As time goes by, the logic will likely improve.
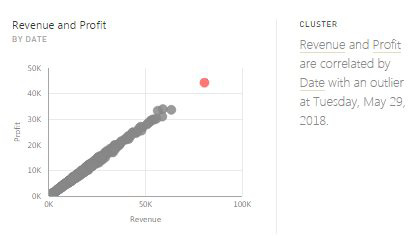
Without any understanding of my (fake) data, the Quick Insights looks for correlations and outliers.
This article is an excerpt from Power Excel With MrExcel