
Transform Your ESPN Fantasy Football Draft Recap Report
August 29, 2021 - by Bill Jelen

Thanks for watching my video on how to transform the ESPN Draft Recap web page into a useful Excel report.
The Excel workbook requires Excel running in Windows using Excel 2016 or newer. Download the Excel workbook.
If that link opens in Excel Online, choose File, Download to Computer and open in Excel for Windows.
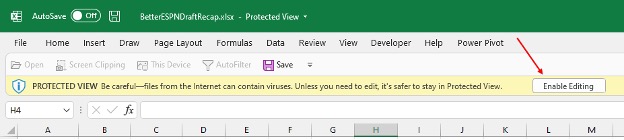
When you open the workbook, you will need to Enable Editing.
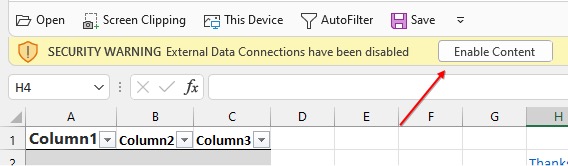
And then enable external connections (Power Query sees everything as an external connection!)
Go to ESPN.com. Find your draft recap. Ours is at a URL similar to this. Yours will have your own League ID:
https://fantasy.espn.com/football/league/draftrecap?leagueId=703855&seasonId=2021
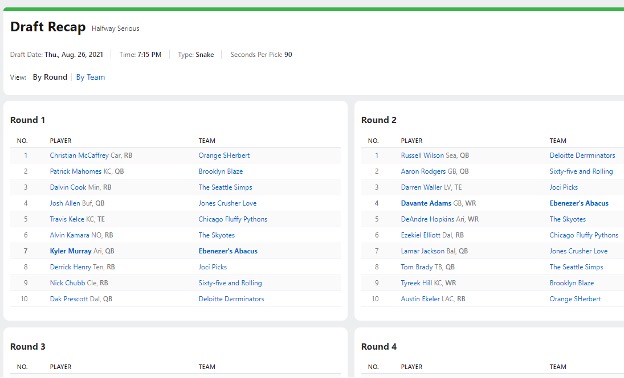
The Draft Recap looks like this:
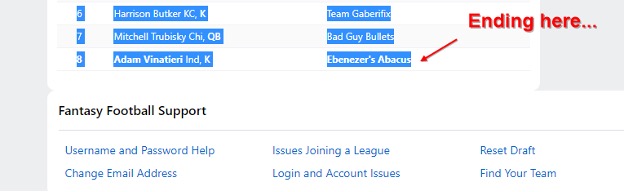
Carefully select the text so it includes the word Round 1...
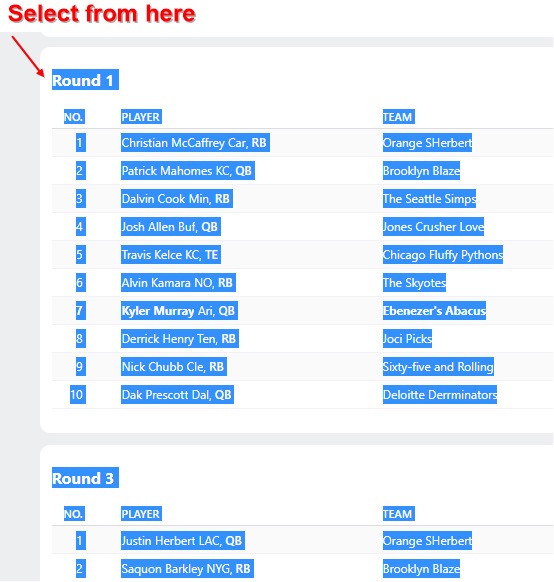
All the way to here...
Copy the selected data from the web page using Ctrl+C.
Open the Excel workbook on a Windows computer using Excel 2016, Excel 2019, or Microsoft 365. If the workbook opens in Protected Mode, choose Enable Editing and then Enable Content.
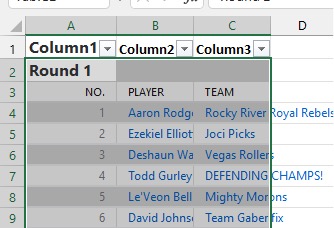
Select cell A2 and paste with Ctrl+V.
After the paste, you should see Round 1 in cell A2.
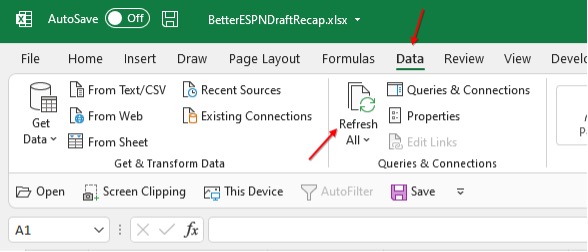
On the Data tab in Excel, click Refresh All
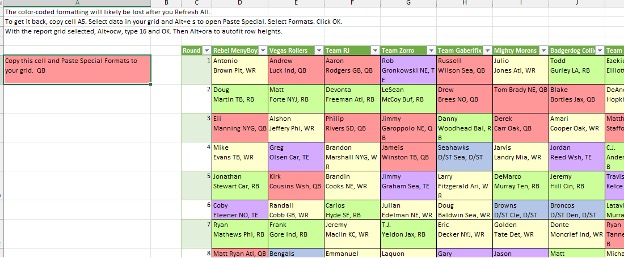
Select the Output worksheet. It should have your teams but not the formatting.
After a refresh, the color-coding appears for any teams who were in the last refresh. This means that unless you have team names like our league (not likely), the color-coding will be lost. Here is how to reapply it:
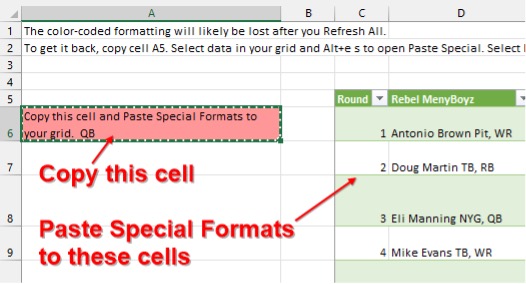
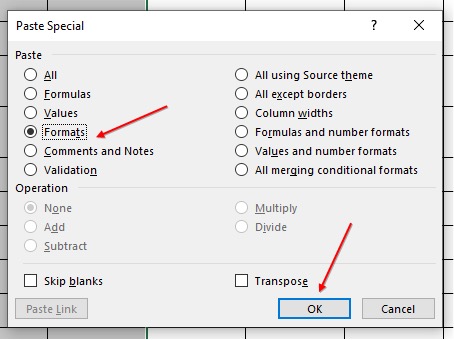
- Select cell A6.
- Ctrl+C to copy that cell
- Select the cells that are not color-coded.
- Press Alt+E and then press s. This opens the Paste Special dialog. Choose Formats. Click OK.
Some simple formatting
- Select from D6 until the end of the data. Keep that selected through steps 2 through 4.
- Home, Format, Column Width, 16, OK
- On the Home tab, click Wrap Text twice to toggle it off and toggle it back on
- Home, Format, AutoFit Row Height.
The final report:
Some tips if you have multiple leagues:
When you paste to cell A2 on the Input sheet, the new paste needs to be taller than the table. If you are going from a large league to a small league, select A2:C999 on the Input worksheet and Home, Delete, Delete Sheet Rows. This will make sure the table only extends to row 2.
If you are looking for a nice-looking draft recap, you are done.

For those of you who already know and love Power Query, here is the M code that Suat Ozgur wrote to format the report.
Suat has some other articles on using Power Query:
Here is the code that you can paste into a blank query. It requires a table named Table1 with three columns labeled: Column1, Column2, and Column3
let
    Source = Excel.CurrentWorkbook(){[Name="Table1"]}[Content],

    TotalRows = Table.RowCount(Source),
    Rounds = Table.SelectRows(Source,
                each Text.Contains(Text.From([Column1]), "Round ")
                    and [Column2] = null
                    and [Column3] = null
            ),

    TotalRounds = Table.RowCount(Rounds),
    TotalTeams = TotalRows / TotalRounds - 2, // Minus two extra header rows
    SplittedSource = Table.Split(Source, TotalTeams + 2),
    Teams = Table.LastN(Table.FromList(SplittedSource{0}[Column3], Splitter.SplitByNothing(), null, null), TotalTeams),

    RoundData = List.Generate(
        () => [i = 0],
        each [i] < List.Count(SplittedSource),
        each [i = [i] + 1],
        each Table.Split(
                Table.Transpose(
                    Table.Sort(
                        Table.LastN(SplittedSource{[i]}, TotalTeams),
                        {{"Column1", if Number.IsOdd([i]) then Order.Descending else Order.Ascending}}
                    )
                ), 1
            ){1}
        ),
    RoundTable  = Table.FromList(RoundData, Splitter.SplitByNothing(), null, null, ExtraValues.Error),

    Output = Table.ExpandTableColumn(RoundTable, "Column1",
                Table.ColumnNames(RoundTable[Column1]{0}),
                Table.ToList(Teams)
            ),
    IndexedOutput = Table.AddIndexColumn(Output, "Round", 1, 1, Int64.Type),
    Result = Table.ReorderColumns(IndexedOutput, List.Combine({{"Round"}, Table.ColumnNames(Output)}))

in
    Result