Charts And Graphs Microsoft Excel 2007

Download files for Charts And Graphs Microsoft Excel 2007
Thanks for buying Charts And Graphs Microsoft Excel 2007.
Download Files for Charts & Graphs for Excel 2007
Thanks for buying Charts & Graphs for Excel 2007! All of the data files used in the book are available for download here. You might use these files to work along with the samples in the book or to view the charts in color.
This page contains:
- Download Files used to create the book
- Links to Charting Resources from the Appendix
Files used in the book:
These are zip files. Right-click the link and choose Save Target As.
- Files for the Introduction
- Files for Chapter 1 - Introducing Excel 2007 Charts
- Files for Chapter 2 - Customizing Charts
- Files for Chapter 3 - Creating Charts that Show Trends
- Files for Chapter 4 - Creating Charts that Show Differences
- Files for Chapter 5 - Creating Charts that Show Relationships
- Files for Chapter 6 - Creating Stock Analysis Charts
- Files for Web query in Chapter 6
- In Chapter 6, LeftDash.gif is the custom marker used to create true OHLC charts.
- Files for Advanced Charting in Chapter 7
- Files for Dynamic Chart shown in Figure 7.38
- Files for Pivot Charts in Chapter 8
In chapter 8, it is difficult to show different groupings in the same file. You can create the following files using the above file, but if you need to see a particular file, then you can download. (Note that each file is 8MB):
- The chart in Figure 8.6
- The chart in Figure 8.8
- The chart in Figure 8.9
- The chart in Figure 8.12
- Files for the Chapter 9 - Presenting Data Visually Without Charts
- Files for the Chapter 10 - Presenting Your Excel Data on a Map
- Files for the Chapter 11 - SmartArt
- Files for the Chapter 12 - PowerPoint
- Files for the Chapter 14 - Chart Lies
For Charting VBA, there are two sets of files available.
- If you are using Excel 97 through Excel 2003, the code from Chapter 10 of the original edition of VBA & Macros for Microsoft Excel would give several examples that will work in your version of Excel.
- If you are using Excel 2007, use the code for Chapter 13 - VBA
- The format series examples starting on page 398 are in Chapter 13a - VBA
- The dynamic user form example on page 414-415 is in Chapter 13b - VBA
- The pivot chart examples at the end of the chapter are in Chapter 13c - VBA
You can also download all of the above zip files (55MB) from ChartingAll.zip
If you have questions about any topic in the book, you can send it to the author, or post to the MrExcel Message Board.
Charting Resources from the Appendix
Gene Zelazny
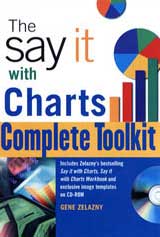
Gene Zelazny is the charting guru for McKinsey & Company. He has produced this excellent Say it With Charts Complete Toolkit that guides you to understanding when to use particular chart types. It is a must-have addition to your collection of books about charting.
You can also browse www.zelazny.com where you can check out Gene's collection of chess sets or order his book of essays, In the Moment
PowerFrameworks.com
The comprehensive PowerFrameworks Library has close to 2,000 frameworks for data charts and concepts such as flows, forces at work, and hierarchies - and it grows every month. It has a tutorial for each series of frameworks, best practices, and examples of finished slides and animation schemes.
If you regularly create charts or presentations, check out a $249 annual subscription to PowerFrameworks.com. PowerFrameworks will supercharge your career.
Books by Edward Tufte
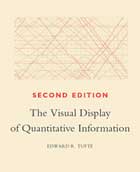
Edward Tufte is an authority on charting. You should, at the very least, check out the Visual Display of Quantitative Information. I bought the whole lot of books for our bookshelf at the office. My only quibble is that ET's books identify bad charts and come off as a bit negative because of this. While Zelazny spends most of his energy showing you good examples of what to do, Tufte spends a lot of time identifying bad things that others have done.
Websites with Charting Tutorials
- Jon Peltier offers several excellent charting examples at https://peltiertech.com/Excel/Charts/index.html.
- Mike Alexander contributed several charting ideas to chapter 7.
- Andy Pope's charts run circles around my advanced charts. When you need something completely out of the box, visit http://www.andypope.info/charts.htm.
- Tushar Mehta offers some non traditional charting examples at http://www.tushar-mehta.com/excel/charts/.
- Tom Bunzel offers many ideas for PowerPoint.
Live Training
Catch any of these speakers for live training:
- Gene Zelazny presents his ideas on Making the Most of Your Business Presentation at business schools throughout the country.
- Edward Tufte runs a series of one-day courses around the country.
- Bill Jelen covers charting in his half-day Power Excel seminars. Schedule a seminar where ever you can gather 25 or more Excellers.
Blogs with an Emphasis on Charting
These blogs often have posts about charting:
- Juice Analytics – Zach and Chris Gemignani often critique charts at their blog.
- Daily Dose of Excel – Many Excel MVPs contribute topics on various Excel topics to Dick Kusleika’s Daily Dose of Excel blog. The link leads to an archive of the charting posts.
- Visual Business Intelligence – Steven Few shows off new and innovative visual designs at his blog.
- Politikal Arithmetik Professor Charles Franklin’s blog always has the latest political charts and analysis. Visit for inspiration on cool charting ideas.
Visual Design Stores
When you are in Toronto, stop by SWIPE and browse their extensive collection of books on advertising and design. The store is located at 477 Richmond Street West, about 1.5 blocks west of Spadina, in Toronto. This is a store that must be browsed to be appreciated. To call them to see if they have a particular title, visit the SWIPE website.
Professional Chart Designers
- Kyle Fletcher created the John Denver chart in the book.
- Bob D'Amico is an illustrator who does a lot of charting work. When I mentioned that I was looking for a chart similar to the illustrations in MAD Magazine, he came through with flying colors. Write to CartoonBob @ mac.com.
- Andy Attilis offers professional chart design services.
Charting Utilities and Products
- Speedometer Chart Creator for Excel.
Other Links in the Book
- Chapter 3, page 119, link to Charles H. Franklin's Approval of Bush chart.

