Back

About MrExcel
Consulting Services
Learn Excel Resources
Challenge of the Month
MrExcel Seminars

Message Board

MrExcel Store
Podcast
Search
Media
Contact
Home


Charting Improvements in Excel 2007


Leo Laporte, Bill Jelen, and Kate Abraham on the set of The Lab on TechTV Canada.

The tip in this show is from Charts and Graphs for Excel 2007.

Excel 2007 offers a new charting engine:
  • Create a new - select your data and press Alt+F1
  • After creating a chart, use the 3 galleries on the Design ribbon to add broad formatting to your chart.
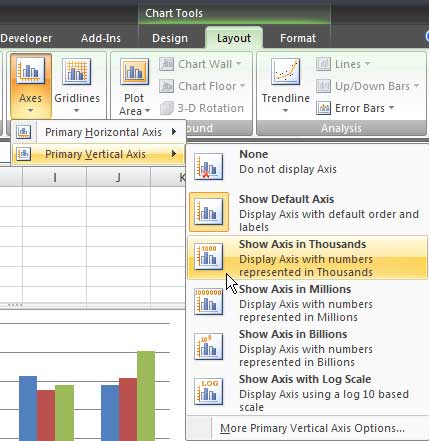
  • In many cases, the built-in choices on the Layout ribbon provide easy access to settings that use to be buried. For example, you can change the axis to show thousands, millions, etc.

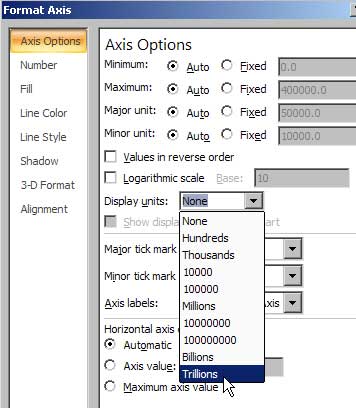
  • Even though the popular options are on the layout ribbon, the More choice at the bottom of each menu offers additional options. For example, Trillions are in the More.

To watch the segment:
(segments are available 3-5 business days after the show airs)

This tip was originally published on June 12, 2007 and aired on TechTV in Canada and Australia on June 12, 2007.

The permanent URL for this page is http://www.mrexcel.com/tip145.shtml.

If you are looking for show notes from another episode, visit my complete list of TechTV appearances.

Check out the home page for The Lab with Leo.

MrExcel.com Consulting can be hired to implement this concept, or many other cool applications, with your data.

MrExcel.com provides examples of Visual Basic procedures for illustration only, without warranty either expressed or implied, including but not limited to the implied warranties of merchantability and/or fitness for a particular purpose. The Visual Basic procedures on this web site are provided "as is" and we do not guarantee that they can be used in all situations.


Excel is a registered trademark of the Microsoft® Corporation.
MrExcel is a registered trademark of Tickling Keys, Inc.

All contents Copyright 1998-2008 by MrExcel Consulting.