Area Chart Help

kwadjo

New Member
Joined
Jun 29, 2010
Messages
11
I am using dynamic ranges to make an area chart so that there is a cliff instead of a slope down to zero. It is mostly working but I haven't figured out how to have the cliff go up from zero if it doesn't start on the first point on the x-axis. If I use a dynamic range then it simply shifts the data over to the y-axis. Here is my example:

2yEf3Fz.jpg


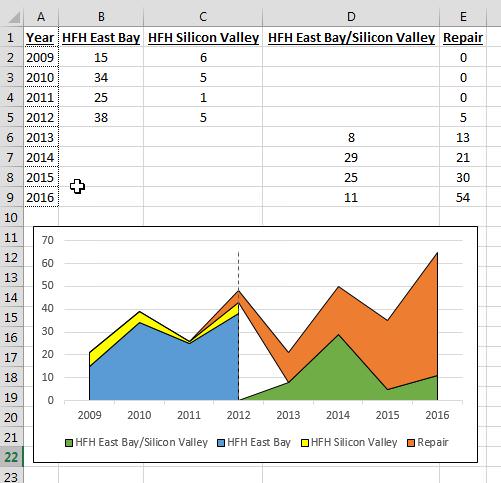
I want the white portion (between 2012 and 2013) to be green. Everything else is correct. I have named ranges for Blue and Yellow, however if I make one for Green, then it gets shifted to start at 2009 instead of 2012.
 

Excel Facts

Difference between two dates
Secret function! Use =DATEDIF(A2,B2,"Y")&" years"&=DATEDIF(A2,B2,"YM")&" months"&=DATEDIF(A2,B2,"MD")&" days"

Forum statistics

Threads
1,215,014
Messages
6,122,697
Members
449,092
Latest member
snoom82

We've detected that you are using an adblocker.

We have a great community of people providing Excel help here, but the hosting costs are enormous. You can help keep this site running by allowing ads on MrExcel.com.
Allow Ads at MrExcel

Which adblocker are you using?

Disable AdBlock

Follow these easy steps to disable AdBlock

1)Click on the icon in the browser’s toolbar.
2)Click on the icon in the browser’s toolbar.
2)Click on the "Pause on this site" option.
Go back

Disable AdBlock Plus

Follow these easy steps to disable AdBlock Plus

1)Click on the icon in the browser’s toolbar.
2)Click on the toggle to disable it for "mrexcel.com".
Go back

Disable uBlock Origin

Follow these easy steps to disable uBlock Origin

1)Click on the icon in the browser’s toolbar.
2)Click on the "Power" button.
3)Click on the "Refresh" button.
Go back

Disable uBlock

Follow these easy steps to disable uBlock

1)Click on the icon in the browser’s toolbar.
2)Click on the "Power" button.
3)Click on the "Refresh" button.
Go back
Back
Top