nparsons75
Well-known Member
- Joined
- Sep 23, 2013
- Messages
- 1,256
- Office Version
- 2016
Hi,
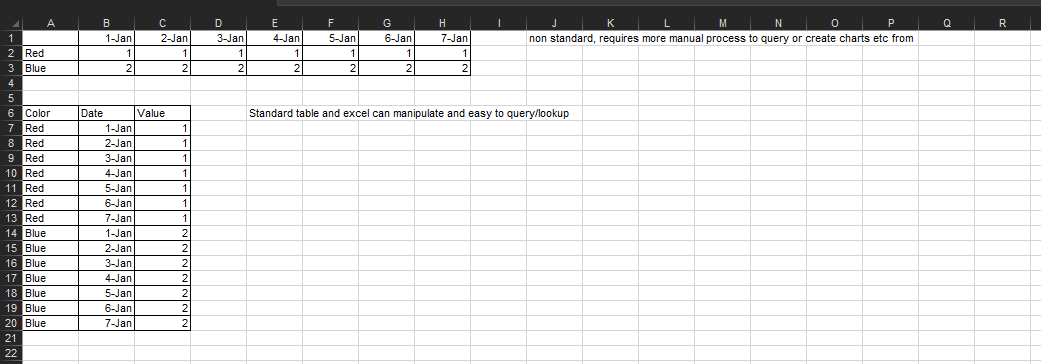
I have a range of data laid out like this. B16:AH21
Dates in the headers of the columns
Data in the rows below the dates.
On my dashboard page I would like to select two criteria.
First, a value from first column.
Second, a date from the column headers.
For example,
In column B I have 5 rows, each row contains a vehicle colour.
RED
GREEN
SILVER
BLACK
WHITE
Across the columns under each date from 1 to 31 depending on the month, there is data. Basically telling me how many of each colour car was sold on that day.
So, from the criteria I choose, I would like to choose colour and data. This will then show all my data in relation to this.