Dynamic chart axis format (Numbers and Percentages)

Myura

New Member
Joined
Feb 26, 2016
Messages
36
Hi!
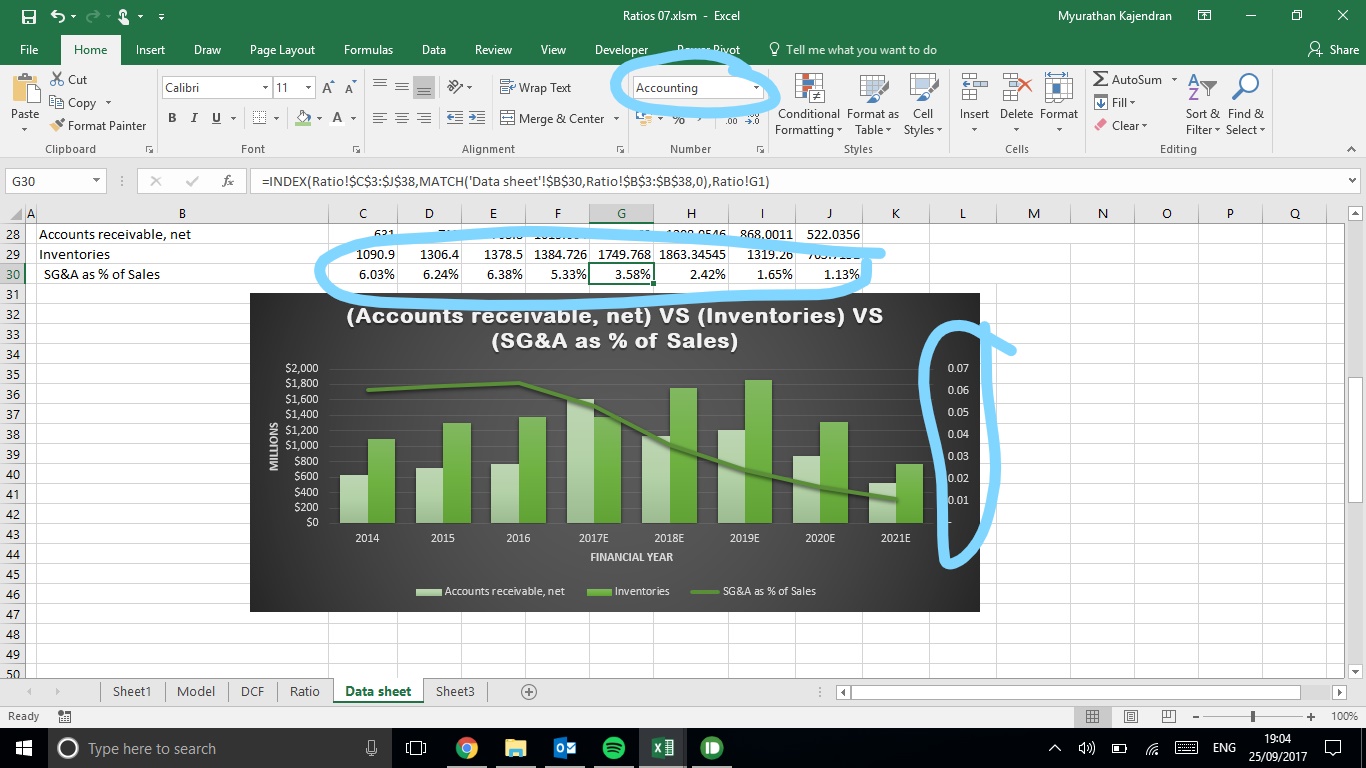
I have created a graph which compares three measures. As I let the users choose the measures, the third measure can be either numbers or percentages. I used conditional formatting to adopt correct formatting. When I created a chart from this and linked the third measure to secondary axis, axis does not display the accurate formatting. Please help me correct this.
R5zkdDR.jpg


aVNW9


aVNW9
aVNW9
 

Excel Facts

Difference between two dates
Secret function! Use =DATEDIF(A2,B2,"Y")&" years"&=DATEDIF(A2,B2,"YM")&" months"&=DATEDIF(A2,B2,"MD")&" days"

Forum statistics

Threads
1,215,566
Messages
6,125,589
Members
449,237
Latest member
Chase S

We've detected that you are using an adblocker.

We have a great community of people providing Excel help here, but the hosting costs are enormous. You can help keep this site running by allowing ads on MrExcel.com.
Allow Ads at MrExcel

Which adblocker are you using?

Disable AdBlock

Follow these easy steps to disable AdBlock

1)Click on the icon in the browser’s toolbar.
2)Click on the icon in the browser’s toolbar.
2)Click on the "Pause on this site" option.
Go back

Disable AdBlock Plus

Follow these easy steps to disable AdBlock Plus

1)Click on the icon in the browser’s toolbar.
2)Click on the toggle to disable it for "mrexcel.com".
Go back

Disable uBlock Origin

Follow these easy steps to disable uBlock Origin

1)Click on the icon in the browser’s toolbar.
2)Click on the "Power" button.
3)Click on the "Refresh" button.
Go back

Disable uBlock

Follow these easy steps to disable uBlock

1)Click on the icon in the browser’s toolbar.
2)Click on the "Power" button.
3)Click on the "Refresh" button.
Go back
Back
Top