VBA Chart with Time on x Axis

sswcharlie

New Member
Joined
Jun 26, 2005
Messages
45
Office Version
  1. 2016
Platform
  1. Web
Hi
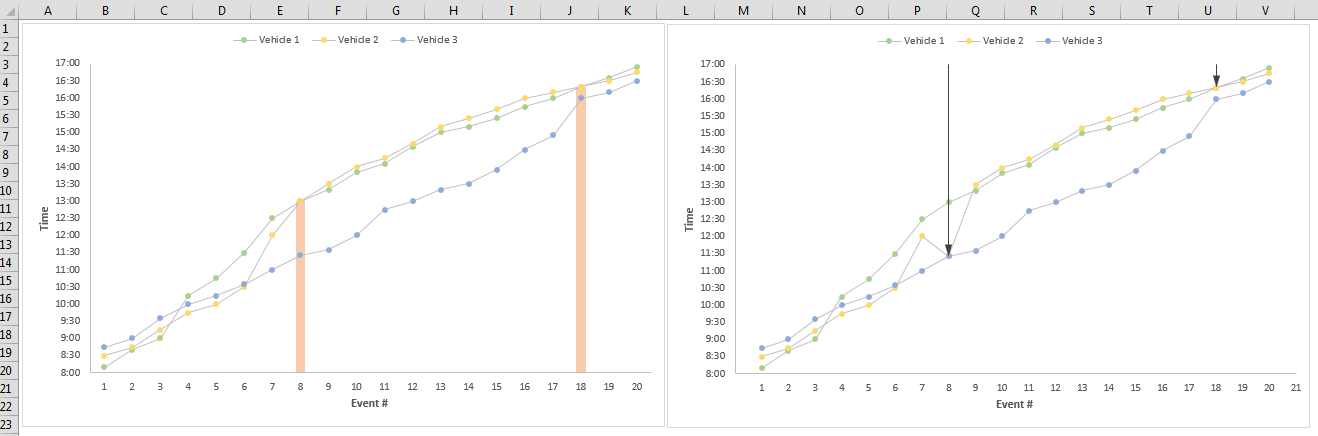
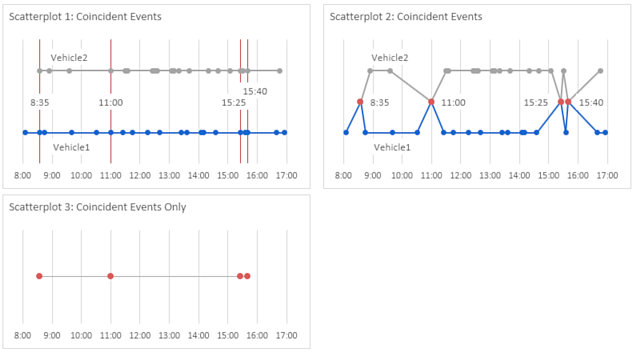
Want a VBA scatterline chart to show time events happened.

Events on y axis sequence from 1 to 20 say
Time on x axis (for only 1 day) from say 0800 to 1700 ( work day) in 30min blocks no overlaps until next day

Series is 1 or more. against each event number - is a time in hours/mins (this listed in sheet column.) eg event 1 0810, event 2 0840, etc

Chart to show with line - time of event 1 (say 0810 with line to time of event 2 (say 0840) etc. The chart will show/enter in correct time, position on axis x, the time between 0800 and 0900 etc

If a time, say event 1 of 0810, gets changed to 0820, chart auto updates.
Chart used to show stopping times of vehicles, several series will show up any problems of vehicles in same place at same time etc


Is there any tutorial that can teach me above, or can someone help with achieving above.
Thanks
Charles Harris
 

Excel Facts

Can a formula spear through sheets?
Use =SUM(January:December!E7) to sum E7 on all of the sheets from January through December
If you want to highlight when some vehicles are at the same place at the same time when you could combine the xy scatter with a column Bar (on the left, easier version) or use an extra XY scatter series with an arrow that points to where the overlap is. Probably the second one is more fancy but if you want to plot 10 vehicles and there could be more than 1 overlap at more than 1 time, for instance vehicle 2 and 3 overlap at 10:00 and then vehicle 6 and 8 overlap at 17:00 and then vehicle 1 and 9 overlap at 14:00 for the same event then it would get messy and also your formulas would need to to check for all combinations.

anyway you can Download the file and play with it


eiyzvql.png
 
Last edited:
Upvote 0
Thanks VBA Geek and thisoldman for posts.

Wow, I never knew so much could be done with charts. Your ideas have given me some more options. Will probably set up 2 or more charts show different options for me. Using Excel2016

VBA Geek – with your charts I am looking to see how it all works. Like number 1 best. Just realised there is a chart on top for the column bar. Will have a play around to see how it works. Will try the x and y in reverse with the time on the horizontal. Is there a edit screen somewhere that shows the type(s) of charts being used. Which scatter chart is used?

Thisoldman – again I am looking to see how it works. Not sure at this point how the coincident is set up, and what chart is used to start.

The vehicles are trains on a model railroad. Probably will run a chart to show all movements even with overlaps, so that operator can change some times (as shown up in the second coincident chart) and then run the first chart again as the final chart for the day.

Once the final chart is done showing all movements including those amended, and from what I have just learnt, I should be able to do a chart over the top that shows acutal progress of the train. That is full day in yellow line in first chart and as each event occurs the operator will show as completed and the overlay second chart will show completed event in another color.

I will do lots of playing around and learning heaps.

Thankyou
Charles Harris
NZ
 
Upvote 0

Forum statistics

Threads
1,215,214
Messages
6,123,665
Members
449,114
Latest member
aides

We've detected that you are using an adblocker.

We have a great community of people providing Excel help here, but the hosting costs are enormous. You can help keep this site running by allowing ads on MrExcel.com.
Allow Ads at MrExcel

Which adblocker are you using?

Disable AdBlock

Follow these easy steps to disable AdBlock

1)Click on the icon in the browser’s toolbar.
2)Click on the icon in the browser’s toolbar.
2)Click on the "Pause on this site" option.
Go back

Disable AdBlock Plus

Follow these easy steps to disable AdBlock Plus

1)Click on the icon in the browser’s toolbar.
2)Click on the toggle to disable it for "mrexcel.com".
Go back

Disable uBlock Origin

Follow these easy steps to disable uBlock Origin

1)Click on the icon in the browser’s toolbar.
2)Click on the "Power" button.
3)Click on the "Refresh" button.
Go back

Disable uBlock

Follow these easy steps to disable uBlock

1)Click on the icon in the browser’s toolbar.
2)Click on the "Power" button.
3)Click on the "Refresh" button.
Go back
Back
Top