Excel 2024: Create a Year-over-Year Report in a Pivot Table


May 6, 2024 - by

Excel 2024: Create a Year-over-Year Report in a Pivot Table

Let's say you have two years worth of detail records. Each record has a daily date. When you build a pivot table from this report, you will have hundreds of rows of daily dates in the pivot table. This is not much of a summary.

Choose one of those date cells in the pivot table. From the Analyze tab in the Ribbon, choose Group Field.

Because you are on a date field, you get this version of the Grouping dialog. In it, deselect Months and select Years. The daily dates are rolled up to years. Move the Years field from Rows to Columns.

Instead of a grand total in column D, you probably want a percentage variance. To get rid of the Grand Total column, right-click on the Grand Total heading and choose Remove Grand Total.)

To build the variance column as shown below, you need to write a formula outside the pivot table that points inside the pivot table. Do not touch the mouse or arrow keys while building the formula, or the often-annoying GETPIVOTDATA function will appear. Instead, simply type =C5/B5-1 and press Enter.

continue reading »

More Reading


Excel 2024: Create Your First Pivot Table

Excel 2024: Create Your First Pivot Table »

May 2, 2024 - by Bill Jelen


Pivot tables let you summarize tabular data to a one-page summary in a few clicks. Start with a data set that has headings in row 1. It should have no blank rows, blank columns, blank headings or merged cells.

Excel 2024: Consolidate Quarterly Worksheets

Excel 2024: Consolidate Quarterly Worksheets »

April 30, 2024 - by Bill Jelen


There are two ancient consolidation tools in Excel. To understand them, say that you have three data sets. Each has names down the left side and months across the top. Notice that the names are different, and each data set has a different number of months.

Excel 2024: Sort and Filter by Color or Icon

Excel 2024: Sort and Filter by Color or Icon »

April 29, 2024 - by Bill Jelen


Conditional formatting got a lot of new features, including icon sets and more than three levels of rules. This allows for some pretty interesting formatting over a large range. But once you format the cells, you might want to quickly see all the ones that are formatted a particular way.

read more articles »

Featured Products


Microsoft Excel VBA and Macros (Office 2021 and Microsoft 365)

April 2022

Use this guide to automate virtually any routine Excel task: save yourself hours, days, maybe even weeks. Make Excel do things you thought were impossible, discover macro techniques you won't find anywhere else, and create automated reports that are amazingly powerful.


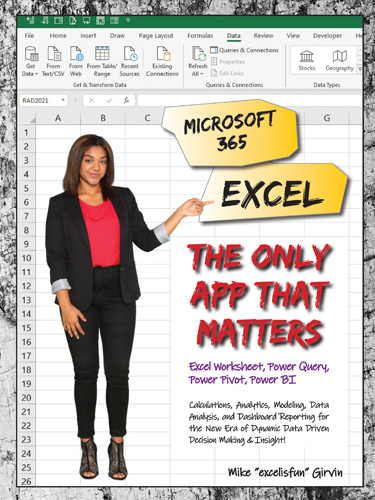
Microsoft 365 Excel: The Only App That Matters

June 2022

Excel Worksheet, Power Query, Power Pivot, Power BI. Calculations, Analytics, Modeling, Data Analysis and Dashboard Reporting for the New Era of Dynamic Data Driven Decision Making & Insight!


Master Your Data with Power Query in Excel and Power BI

August 2021

Despite the moniker "data monkey," we information workers are often more like data magicians. Our data seldom enters our world in a ready-to-consume format; it can take hours of cleaning, filtering, and reshaping to get things ready to go. Power Query will make this process faster the first time and reduce it to a single button click every subsequent time.


MrExcel 2021 - Unmasking Excel

February 2021

This is a 5th edition of MrExcel XL. Updates for 2021 include: LAMBDA, LET, Power Query Fuzzy Match, Sort & Filter in Sheet View, Cut-out people, Save object as image, STOCKHISTORY, Wolfram Alpha Data Types, Custom Data Types from Power Query, Weather data types, bilingual spreadsheets, Performance improvements, Unhide multiple worksheets, Action pen, Collapsible task panes, LET function to re-use calculations, store formulas using LAMBDA, Recursive LAMBDA, Branching LAMBDA, Lambda to return a picture, Excel function quick reference.


see more products »