Hi,
I have no idea if you can do this in excel or not. I can't attach the spreadsheet or paste the image I wanted because it is hard to explain but here goes.
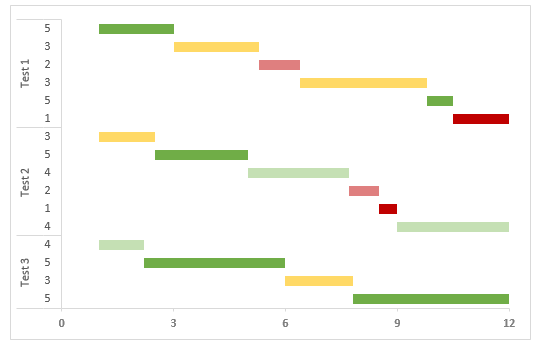
I want a bar chart that on the vertical axis say test1, test2, test3. The horizontal axis have 1 to 12. So it will have a bar for test1 from 1 - 3 then 3 - 5.3 and they are colour coded by the rating of 5 and 3 and so on.
Does that make sense? Is it possible?
<tbody>
</tbody>
I have no idea if you can do this in excel or not. I can't attach the spreadsheet or paste the image I wanted because it is hard to explain but here goes.
I want a bar chart that on the vertical axis say test1, test2, test3. The horizontal axis have 1 to 12. So it will have a bar for test1 from 1 - 3 then 3 - 5.3 and they are colour coded by the rating of 5 and 3 and so on.
Does that make sense? Is it possible?
| test1 | ||
| KM start | KM end | Rating |
| 1 | 3 | 5 |
| 3 | 5.3 | 3 |
| 5.3 | 6.4 | 2 |
| 6.4 | 9.8 | 3 |
| 9.8 | 10.5 | 5 |
| 10.5 | 12 | 1 |
| test2 | ||
| KM start | KM end | Rating |
| 1 | 2.5 | 3 |
| 2.5 | 5 | 5 |
| 5 | 7.7 | 4 |
| 7.7 | 8.5 | 2 |
| 8.5 | 9 | 1 |
| 9 | 12 | 4 |
| test3 | ||
| KM start | KM end | Rating |
| 1 | 2.2 | 4 |
| 2.2 | 6 | 5 |
| 6 | 7.8 | 3 |
| 7.8 | 12 | 5 |
<tbody>
</tbody>