Dynamic Charts with Multiple Series - Data Label configuration question (no macros)

ZL1

New Member
Joined
Oct 23, 2012
Messages
31
open
Hello,

So I'm a pretty avid excel user and have all types of cool little tricks and tips i've done over the years with my data...

Today, i'm not able to figure this out.. and maybe there isn't a solution (as i've googled and googled and googled).

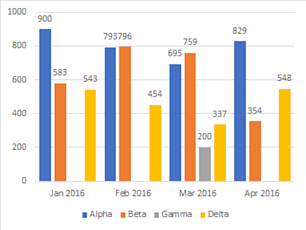
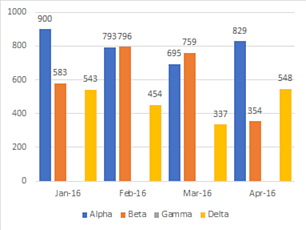
I have a chart that has 5 series tied to it. The Series are based off years, broken down by months (series 1 = Jan - Dec for Year selected). The Data selected is a user input range. so it can be a start point of 1/1/2018 and end point of 3/1/201/ and the chart will only show the 3 months. or the user can input 1/1/2013 and end point 1/1/18 and the chart will show the 5 years (month by month comparison for the span of the years).

So, it's easy enough to have offset named ranges to only select the data i need, and i hide the blanks on the chart by using na(), and all of that works great. But when i add data labels, the series that have no data (blanks or 1 designated na() cell), the labels can't be hidden for that cell. Is there a way to make the Series Labels dynamic so that if the series has no data, the labels do not show up? I've tried configuring the number format to $#,###"" but then the $ still shows up.

Only thing I've managed to do is exclude the labels all together, but it looks bare.

any help without a macro would be appreciated.
 

Excel Facts

Will the fill handle fill 1, 2, 3?
Yes! Type 1 in a cell. Hold down Ctrl while you drag the fill handle.
This is a line or scatter chart?

To be clear, are you talking about data labels or do you mean legend entries? When I add or delete points to a chart with data labels, the data labels appear and disappear with the display of the point.
 
Upvote 0
This is a line or scatter chart?

To be clear, are you talking about data labels or do you mean legend entries? When I add or delete points to a chart with data labels, the data labels appear and disappear with the display of the point.

The legend entries stay as well, but I've made a filler for those just saying "no data" with it's associated color. I didn't even try to get rid of those, didn't think I could without removing the series or deleting the legend all together, which isn't something I'm looking to do.

So it will be the data labels the float above the bars on the graph themselves that indicate the value of the graphed data field.
 
Upvote 0
OK, it's a column chart, correct?

I'm using Excel 2016 standalone. When I graph this as a clustered column chart,

AlphaBetaGammaDelta
Jan 2016900583#N/A543
Feb 2016793796#N/A454
Mar 2016695759200337
Apr 2016829354#N/A548

<tbody>
</tbody>

Data labels don't appear for #N/A values.

XYve77f.png


Aside: There are a few tricks for creating dynamic legends. They often place the legend in cells outside but adjacent to the chart object or use linked images. Charley Kyd shows one example: http://www.exceluser.com/excel_dashboards/how-to-create-dynamic-chart-legends.htm. Mr. Kyd also provides tips on using the camera tool in other tutorials.

This is correct, and for the most part how my graph looks when each series has at least one data point.

The only thing that doesn't follow is when the series has 0 data points. It will say #n/a on the graph (not errors, I'm using the na() in my data so it's pulling the first one available ).

So in this case, remove the 200 from gamma and make that an na() value and see if the label will still disappear or if it will show #n/a
 
Upvote 0
try this

Code:
Sub AddSomeLabels()
Dim sc As Series
Dim vals
Dim x As Integer
    For Each sc In ActiveChart.SeriesCollection  ' chart must be selected
        sc.DataLabels.ShowValue = False   ' turn off data labels
        vals = sc.Values
        For x = LBound(vals) To UBound(vals)
            If vals(x) > 0 Then
                sc.Points(x).ApplyDataLabels
            End If
        Next
    Next
End Sub

Never mind... I missed the request for no macros.
 
Last edited:
Upvote 0
AlphaBetaGammaDelta
Jan-16900583#N/A543
Feb-16793796#N/A454
Mar-16695759#N/A337
Apr-16829354#N/A548

<tbody>
</tbody>

Gamma cells contain =NA()

27GJ5iy.png
 
Upvote 0
try this

Code:
Sub AddSomeLabels()
Dim sc As Series
Dim vals
Dim x As Integer
    For Each sc In ActiveChart.SeriesCollection  ' chart must be selected
        sc.DataLabels.ShowValue = False   ' turn off data labels
        vals = sc.Values
        For x = LBound(vals) To UBound(vals)
            If vals(x) > 0 Then
                sc.Points(x).ApplyDataLabels
            End If
        Next
    Next
End Sub

Never mind... I missed the request for no macros.

thanks for response though.

would this macro turn off ALL data labels, or just blank series data labels?

i have a named range called "getchart" that converts a picture into a chart based off a data list drop down box with a list of created charts. so the charts are all hidden on a separate page, so they'll never actually be 'selected' unless i'm editing / modifying the chart. not sure if that would affect the macro or not. (there are around 5 charts at the moment, sheet is designed to have the ability to create 13 unique dynamic graphs).
 
Upvote 0
I don't know how to share pictures like that, but here is what mine does, i have them in google drive, which i'm not sure is exactly allowed or not..

Chart with 5 series points, labels visible - from this chart, you will see the data lables blank for April - May (these are na()), but then in Jan, you'll see #n/a on the chart as a label which is also na() - and the only data point in the series (since I use an offset formula in the named range - link #3 ), i need it to pull 1 value or the sheet populates an error box).
https://drive.google.com/open?id=1Sz4M7B1NR6lSAZftP9kiLM01PhvnALW0

Chart Labels Series View
https://drive.google.com/open?id=1_AcVKGlF8TXPy6OC1NNespKajEPOhXE-

Chart Data View with named range - when i remove the offset formula the offset formula and map just the selected data range, they all show #n/a instead of just for january.
https://drive.google.com/open?id=1VrOw6ddMfTa41eYWKWCkqMRSHKsRFS2n


Edit: This might be a stretch, but when the data label is configured with a $, do the results show the same for yours?
 
Last edited:
Upvote 0
This will do all charts on a sheet that you specifiy.

Yes, it first turns off all labels on the series, then adds back the ones with a positive value.


Code:
Sub DoEmAll()

Dim ws As Worksheet
Dim co As ChartObject
Set ws = Sheets("Sheet1")  ' sheet name where charts are located
For Each co In ws.ChartObjects
    Call AddSomeLabels(co)
Next
End Sub

Sub AddSomeLabels(co As ChartObject)

Dim sc As Series
Dim vals
Dim x As Integer
On Error Resume Next
    
    For Each sc In co.Chart.SeriesCollection
        sc.DataLabels.ShowValue = False   ' turn off data labels
        vals = sc.Values
        For x = LBound(vals) To UBound(vals)
            If vals(x) > 0 Then
                sc.Points(x).ApplyDataLabels
            End If
        Next
    Next
End Sub
 
Last edited:
Upvote 0

Forum statistics

Threads
1,215,126
Messages
6,123,198
Members
449,090
Latest member
bes000

We've detected that you are using an adblocker.

We have a great community of people providing Excel help here, but the hosting costs are enormous. You can help keep this site running by allowing ads on MrExcel.com.
Allow Ads at MrExcel

Which adblocker are you using?

Disable AdBlock

Follow these easy steps to disable AdBlock

1)Click on the icon in the browser’s toolbar.
2)Click on the icon in the browser’s toolbar.
2)Click on the "Pause on this site" option.
Go back

Disable AdBlock Plus

Follow these easy steps to disable AdBlock Plus

1)Click on the icon in the browser’s toolbar.
2)Click on the toggle to disable it for "mrexcel.com".
Go back

Disable uBlock Origin

Follow these easy steps to disable uBlock Origin

1)Click on the icon in the browser’s toolbar.
2)Click on the "Power" button.
3)Click on the "Refresh" button.
Go back

Disable uBlock

Follow these easy steps to disable uBlock

1)Click on the icon in the browser’s toolbar.
2)Click on the "Power" button.
3)Click on the "Refresh" button.
Go back
Back
Top