Hi bhandari,
I've got the newest chart examples in 2017-12-12_working_bhandari.xlsx
I'm using embedded charts rather than separate chart sheets, one chart per worksheet tab. I used two different sets of ground level data: 7800 and 9025.
Charts to be printed using A0 paper.
841 x 1189 mm or 33.1 x 46.8 in
I allow for printed page margins 25 mm on all four sides, printable area: 791 x 1139 mm
Horizontal axis major divisions = 3 m, minor divisions = 0.3 m
Vertical axis major divisions = 2 m, minor divisions = 0.2 m
Upper fixed bound: 456 m
Lower fixed bound: 402 m
I entered the length and width dimensions in Notes!G5:G6 as the chart size dimensions. Excel changed 44.84 x 31.14 to 44.38 x 30.53.
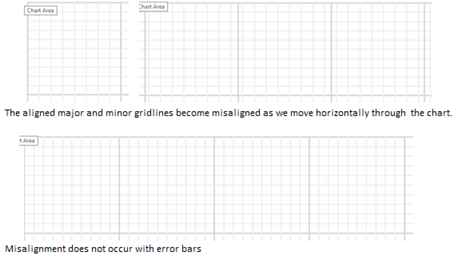
On my monitor, at 100% magnification, the minor and major gridlines do not align. I do not know if this misalignment is due to the Excel software or if it's due to video and monitor drivers.
Excel does not have true WYSIWYG, What You See Is What You Get. The worksheet tab, the print preview, and the actual printed page always have differences. I do not know what the acceptable tolerance level might be with your hardware.
The two *Defaults charts are the data plotted with no attempt to create a square grid.
With the two *YheightAdj charts, I reduced the vertical plot area height to create a grid of squares. The plotted height does not use a full paper sheet width.
With the two *NewYMax charts, I increased the upper bound of the vertical axis and then adjusted both vertical and horizontal chart dimensions to use as much of the paper sheet as possible.
Are any of these charts acceptable?
https://www.dropbox.com/s/ybhlk3fp5wvtoib/2017-12-12_working_bhandari.xlsx?dl=0