Is there any type of Macro or way in excel that can make a single bar on a bar graph change colors if it is passed a certain limit.
Right now my bar graph has data that is automatically updated every 10 minutes. Can we get it for a bar to change colors when a value in the range of where it is getting its data passes the value of another cell.
Thank you so much if anyone has any help to do this. I have excel 2010.
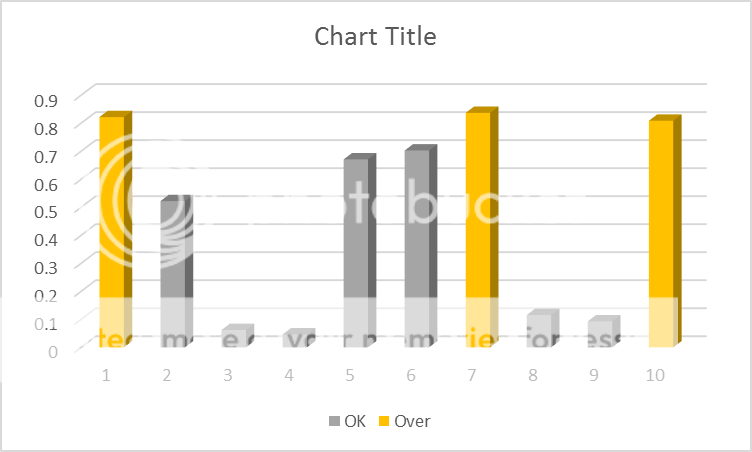
I created two extra columns which I was going to put on the chart. One column has the values from the original series below the limit and the other has the data values above the limit. I then used a stacked bar chart to display both columns.
We have a great community of people providing Excel help here, but the hosting costs are enormous. You can help keep this site running by allowing ads on MrExcel.com.
Allow Ads at MrExcel
Which adblocker are you using?
Disable AdBlock
Follow these easy steps to disable AdBlock
1)Click on the icon in the browser’s toolbar. 2)Click on the icon in the browser’s toolbar. 2)Click on the "Pause on this site" option.
Go back
Disable AdBlock Plus
Follow these easy steps to disable AdBlock Plus
1)Click on the icon in the browser’s toolbar. 2)Click on the toggle to disable it for "mrexcel.com".
Go back
Disable uBlock Origin
Follow these easy steps to disable uBlock Origin
1)Click on the icon in the browser’s toolbar. 2)Click on the "Power" button. 3)Click on the "Refresh" button.
Go back
Disable uBlock
Follow these easy steps to disable uBlock
1)Click on the icon in the browser’s toolbar. 2)Click on the "Power" button. 3)Click on the "Refresh" button.