Hello,
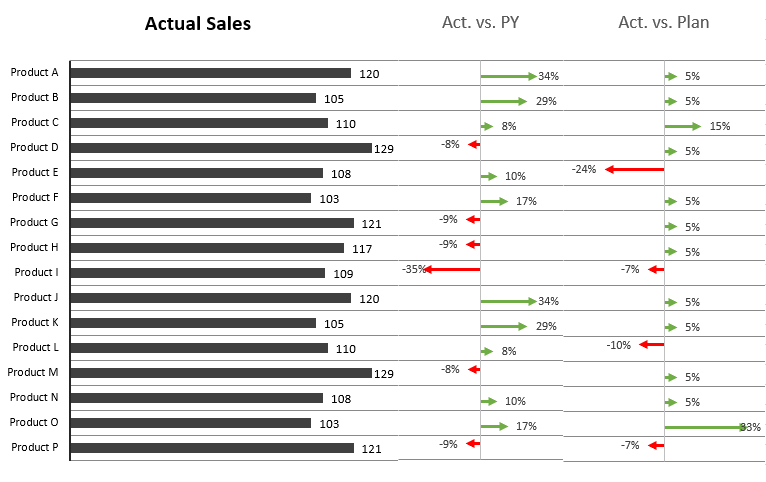
i'm trying to align grid lines of 3 separate Excel charts as seen on image (i'm new to charts), representing Actual sale by products and % variance to Plan/Prior Year.
Manually i cannot align them to the exact alignment (check the mismatch on last grid lines below):
Is it possible to align grid lines just by setting the correct dimensions of chart/plot area?
Is there any better way to achieve the same result ? maybe by combining all 3 charts using a combo chart?
I've used charts originally created & posted on www.xelplus.com.
Many thanks & best regards,
Matjaž


