MrExcel LX – The Holy Grail of Excel Tips
February 2019

Covers Excel Backwards and Forwards
"A book for people who use Excel 40+ hours per week. Illustrated in full color."
Add to Cart: $9.99 »- 212 Pages
- Publisher: Holy Macro! Books
- ISBN: 978-1-61547-063-1
- PDF ISBN: 978-1-61547-148-5
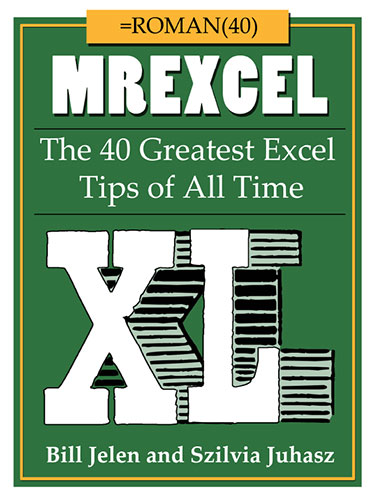
I keep a spreadsheet that lists the books I‘ve authored. A few years ago I realized I would soon be writing book #40 and that the =ROMAN(40) is XL. Get it? XL sounds like “Excel”? Because of this joke, the MrExcel XL book was born. It became a staple at my live Power Excel seminars. For this updated third edition, I am going with Excel 60 (or, in Roman numbers, LX, which is XL backwards!)This is the book I use in my live Power Excel seminars.
This third edition is updated for features introduced in 2018 & 2019 such as Geography Data Types, Stock Quotes, Artificial Intelligence, and the new Dynamic Arrays such as SORT, SORTBY, FILTER, and UNIQUE. There are also new tips that I’ve learned in the last two years.
I was Maitland Florida doing a seminar the week after XLOOKUP was released. Everyone in the room had a new copy of MrExcel LX in their hands. I made a joke, "XLOOKUP is great, except it makes this book officially obsolete." It got a big laugh. So I repeated that joke on YouTube. Someone suggested that I should update the e-Book edition of MrExcel LX with XLOOKUP. I've done that. If you buy this book from MrExcel.com, your purchase will automatically include the PDF of MrExcel 2020 - a version of this book that includes XLOOKUP and a few other items added to Excel for Office 365.
- #1 Double-Click the Fill Handle to Copy a Formula
- #2 Break Apart Data
-
#3 Filter by Selection
- Bonus Tip: Filter by Selection for Numbers Over/Under
- #4 Bonus Tip: Total the Visible Rows
-
#5 The Fill Handle Does Know 1, 2, 3...
- Bonus Tip: Fill Jan, Feb, ..., Dec, Total
-
#6 Fast Worksheet Copy
- Bonus Tip: Put the Worksheet Name in a Cell
- Bonus Tip: Add a Total Row and a Total Column with One AutoSum
- Bonus Tip: Power Up the Status Bar Statistics
- Bonus Tip: Change All Sheets with Group Mode
- Bonus Tip: Create a SUM That Spears Through All Worksheets
- Bonus Tip: Use INDIRECT for a Different Summary Report
-
#7 Use Default Settings for All Future Workbooks
- Bonus Tip: Changes to Book Template are Cumulative
- Bonus Tip: Replace the Comma Style in Book.xltx
- #8 Recover Unsaved Workbooks
-
#9 Simultaneously Edit the Same Workbook in Office 365
- Bonus Tip: AutoSave is Necessary, But Turn it Off When Not Co-Authoring
- Bonus Tip: Undo an AutoSave
-
#10 New Threaded Comments Allow Conversations 28
- Bonus Tip: Old Style Comments Are Available as Notes
- Bonus Tip: Add a Tooltip to a Cell with Validation
- #11 Create Perfect One-Click Charts
- #12 Paste New Data on a Chart
- #13 Create Interactive Charts
- #14 Show Two Different Orders of Magnitude on a Chart
- #15 Create Waterfall Charts
- #16 Create Funnel Charts in Office 365
- #17 Create Filled Map Charts in Office 365
- #18 Create a Bell Curve
- #19 Plotting Employees on a Bell Curve
- #20 Add Meaning to Reports Using Data Visualizations
- #21 Sort East, Central, and West Using a Custom List
- #22 Sort Left to Right
-
#23 Sort Subtotals
- Bonus Tip: Fill in a Text Field on the Subtotal Rows
- Bonus Tip: An Easier Way to Fill in a Text Field on Subtotal Rows
- Bonus Tip: Format the Subtotal Rows
- Bonus Tip: Copy the Subtotal Rows
- #24 Sort and Filter by Color or Icon
- #25 Consolidate Quarterly Worksheets
- #26 Get Ideas from Artificial Intelligence
-
#27 Create Your First Pivot Table
- Bonus Tip: Rearrange fields in a pivot table
- Bonus Tip: Format a Pivot Table
- Bonus Tip: Format One Cell in a Pivot Table
- Bonus Tip: Fill in the Blanks in the Annoying Outline View
-
#28 Create a Year-over-Year Report in a Pivot Table
- Bonus Tip: Another Way to Calculate Year-Over-Year
-
#29 Change the Calculation in a Pivot Table
- Bonus Tip: Why Do Pivot Tables Count Instead of Sum?
- #30 Find the True Top Five in a Pivot Table
-
#31 Specify Defaults for All Future Pivot Tables
- Bonus Tip: Change What Drives You Crazy About Excel
-
#32 Make Pivot Tables Expandable Using Ctrl+T
- Bonus Tip: Use Ctrl+T with VLOOKUP and Charts
- #33 Replicate a Pivot Table for Each Rep
-
#34 Use a Pivot Table to Compare Lists
- Bonus Tip: Show Up/Down Markers
- Bonus Tip: Compare Two Lists by Using Go To Special
-
#35 Build Dashboards with Sparklines and Slicers
- Bonus Tip: Make Your Workbook into a Web App
- Bonus Tip: Line Up Dashboard Sections with Different Column Widths
- Bonus Tip: Use Picture Lookup
- Bonus Tip: Report Slicer Selections in a Title
- #36 See Why GETPIVOTDATA Might Not Be Entirely Evil
-
#37 Eliminate VLOOKUP with the Data Model
- Bonus Tip: Count Distinct
-
#38 Compare Budget Versus Actual via Power Pivot
- Bonus Tip: Portable Formulas
- Bonus Tip: Text in the Values of a Pivot Table
- #39 Slicers for Pivot Tables From Two Data Sets
-
#40 Use F4 for Absolute Reference or Repeating Commands
- Bonus Tip: Use a Named Range Instead of Absolute References
-
#41 Quickly Convert Formulas to Values
- Bonus Tip: Skip Blanks While Pasting
-
#42 See All Formulas at Once
- Bonus Tip: Highlight All Formula Cells
- Bonus Tip: Trace Precedents to See What Cells Flow into a Formula
- Bonus Tip: See Which Cells Depend on the Current Cell
- #43 Audit a Worksheet With Spreadsheet Inquire
- #44 Discover New Functions by Using fx
- #45 Use Function Arguments for Nested Functions
-
#46 Calculate Nonstandard Work Weeks
- Bonus Tip: Use WORKDAY.INTL for a Work Calendar
-
#47 Turn Data Sideways with a Formula
- Bonus Tip: Protect Rows with an Array Formula
-
#48 Handle Multiple Conditions in IF
- Bonus Tip: Use Boolean Logic
- #49 Troubleshoot VLOOKUP
-
#50 Use a Wildcard in VLOOKUP
- Bonus Tip: VLOOKUP to Two Tables
- #51 Replace Columns of VLOOKUP with a Single MATCH
- #52 Use the Fuzzy Lookup Tool from Microsoft Labs
- #53 Lookup to the Left with INDEX/MATCH
- #54 Preview What Remove Duplicates Will Remove
-
#55 Replace Nested IFs with a Lookup Table
- Mini Bonus Tip: Match the Parentheses
- #56 Suppress Errors with IFERROR
- #57 Handle Plural Conditions with SUMIFS
-
#58 Geography & Stock Data Types in Excel
- Bonus Tip: Use Data, Refresh All to Update Stock Data
- #59 Dynamic Arrays Can Spill
- #60 Sorting with a Formula
-
#61 Filter with a Formula
- Bonus Tip: Understanding Array Constants
-
#62 Formula for Unique or Distinct
- Bonus Tip: Use # "The Spiller" to Refer to All Array Results
- #63 Other Functions Can Now Accept Arrays as Arguments
- #64 One Hit Wonders with UNIQUE
- #65 SEQUENCE inside of other Functions such as IPMT
-
#66 Replace a Pivot Table with 3 Dynamic Arrays
- Bonus Tip: Replace Ctrl+Shift+Enter with Dynamic Arrays
- #67 Dependent Validation using Dynamic Arrays
- #68 Complex Validation Using a Formula
- #69 Use A2:INDEX() as a Non-Volatile OFFSET
- #70 Subscribe to Office 365 for Monthly Features
-
#71 Find Largest Value That Meets One or More Criteria
- Bonus Tip: Concatenate a Range by Using TEXTJOIN
- #72 Less CSV Nagging and Better AutoComplete
- #73 Speed Up VLOOKUP
- #74 Protect All Formula Cells
- #75 Back into an Answer by Using Goal Seek
-
#76 Do 60 What-If Analyses with a Sensitivity Analysis
- Bonus Tip: Create a Data Table from a Blank Cell
- #77 Find Optimal Solutions with Solver
- #78 Improve Your Macro Recording
- #79 Clean Data with Power Query
- #80 Render Excel Data on an iPad Dashboard Using Power BI
- #81 Build a Pivot Table on a Map Using 3D Maps
- #82 The Forecast Sheet Can Handle Some Seasonality
- #83 Perform Sentiment Analysis in Excel
- #84 Fill in a Flash
- #85 Format as a Façade
- #86 Word Cloud using Custom Visuals in Excel
- #87 Surveys & Forms in Excel
- #88 Use the Windows Magnifier
-
#89 Word for Excellers
- Bonus Tip: Merge Shapes
- Bonus Tip: Use the Eye Dropper
-
#90 Avoid Whiplash with Speak Cells
- Bonus Tip: Provide Feedback with Sound
- Bonus Tip: A Great April Fool’s Day Trick
-
#91 Customize the Quick Access Toolbar
- Bonus Tip: Sometimes, You Don't Want the Gallery
- Bonus Tip: Show QAT Below the Ribbon
-
#92 Create Your Own QAT Routines Using VBA Macros
- Bonus Tip: Settings in the Excel Options Menu
- #93 Favorite Keyboard Shortcuts
- #94 Ctrl+Click to Unselect Cells
- #95 More Excel Tips
- #96 Excel Stories
- #97 Index


