Pivot Table Grouping / Nesting Question

jackbergersen

New Member
Joined
Apr 23, 2009
Messages
13
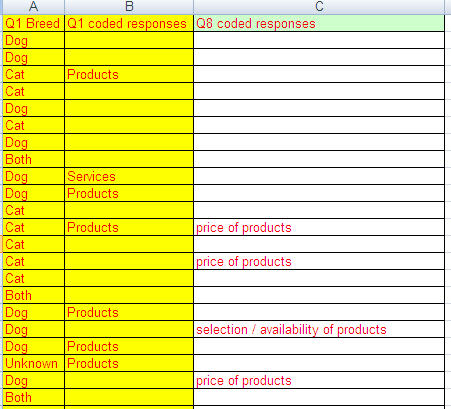
I am having an issue with getting a Pivot Table to display data how I would like to report on it. The column labels are fine, and when I put one field into the row label section, I see data how I would like to. When I add another field to the Row Label section, it nests this within the first question, where I really just want to keep them grouped seperately by field and display in one table. I think the graphics below will help explain this better.


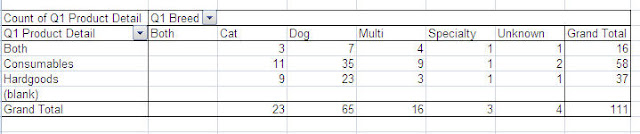
Pivot Table with 1 field for the row & column sections, which is fine:

pivot1.jpg


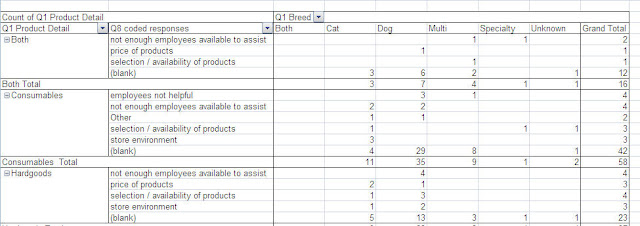
When I add the second field in, the fields 'nest', whereas I would like them to 'group':

pivot2.jpg


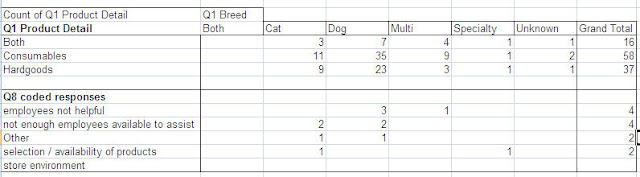
Ideally, I would like them to stay grouped by each field, similiar to below (This is all hardcoded, I just wanted to show my ideal output):

pivot3.jpg


I have been banging my head against this for hours now, and would really appreciate any help. Thanks!
 

Excel Facts

Create a chart in one keystroke
Select the data and press Alt+F1 to insert a default chart. You can change the default chart to any chart type
I think you've posted this question on other forums also (please detail accordingly).

Based on your screenshots - you would need to redesign the layout of your source data.

"Questions" would be the heading with appropriate value stored on a transaction level basis.
Responses & Breed would be the other transaction level values.

Code:
Question | Response | Breed
Q1 Product Detail | Both | Dog
Q8 code responses | Other | Multi
Q1 Product Detail | Consumables | Cat
etc...

From the above source data you could then set Question & Response as Row Fields with Breed as Column Field and Data Field (set to COUNT).

(it's not clear how Breed is presently recorded - implication being it's related to Q1 specifically whereas in reality you should replicate for each Q given your proposed final PT layout....)
 
Upvote 0
Thanks for the reply! Yes, I did post on one other message board (apologies if this is against the T&C of either site).

I think I am a bit confused by your proposed solution, the source data is currently laid out as transactional data (survey results), and is formatted like the following example:

psmt4.jpg


Thanks again!
 
Upvote 0

Forum statistics

Threads
1,215,016
Messages
6,122,700
Members
449,092
Latest member
snoom82

We've detected that you are using an adblocker.

We have a great community of people providing Excel help here, but the hosting costs are enormous. You can help keep this site running by allowing ads on MrExcel.com.
Allow Ads at MrExcel

Which adblocker are you using?

Disable AdBlock

Follow these easy steps to disable AdBlock

1)Click on the icon in the browser’s toolbar.
2)Click on the icon in the browser’s toolbar.
2)Click on the "Pause on this site" option.
Go back

Disable AdBlock Plus

Follow these easy steps to disable AdBlock Plus

1)Click on the icon in the browser’s toolbar.
2)Click on the toggle to disable it for "mrexcel.com".
Go back

Disable uBlock Origin

Follow these easy steps to disable uBlock Origin

1)Click on the icon in the browser’s toolbar.
2)Click on the "Power" button.
3)Click on the "Refresh" button.
Go back

Disable uBlock

Follow these easy steps to disable uBlock

1)Click on the icon in the browser’s toolbar.
2)Click on the "Power" button.
3)Click on the "Refresh" button.
Go back
Back
Top