Products
February 2018
If you want to be able to supercharge Power BI, you need to learn to write DAX. Data Analysis Expressions (DAX) is the formula language of Power BI and Power Pivot for Excel. This book prompts the reader to put your new skills to the test. Written to give you hands-on practice using Power BI Desktop and writing DAX.
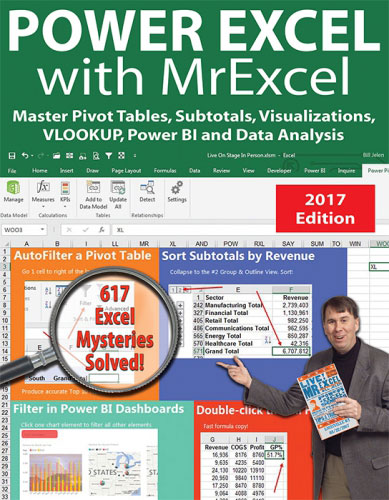
Power Excel With MrExcel - 2017 Edition
January 2017
This is the print book edition of "Power Excel with MrExcel - 2017 Edition" - by Bill Jelen. Master Pivot Tables, Subtotals, Visualizations, VLOOKUP, Power BI and Data Analysis.
November 2016
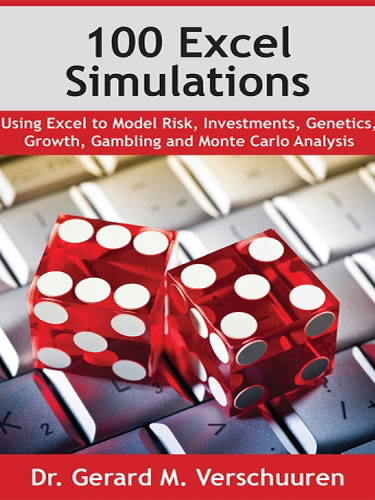
Covering a variety of Excel simulations, from gambling to genetics, this introduction is for people interested in modeling future events, without the cost of an expensive textbook.
June 2016
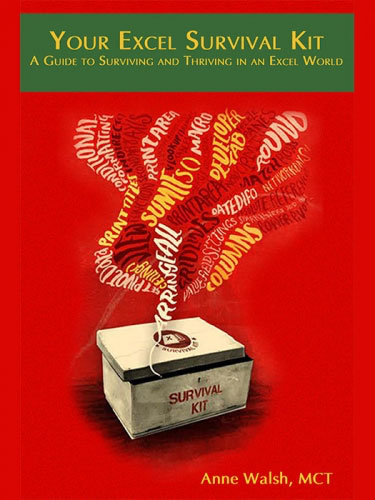
This book helps you realize that Excel is on your side. It can be your friend, not your enemy. If and when you upgrade your Excel skills you will experience many positives: you will learn to love Excel, you will learn how to use Excel to become an invaluable asset in your workplace.
April 2016
Excel Video Medley covers everything from Pivot Tables to VLOOKUP to VBA. Learn how to create scientific graphs. Use Excel for statistics.
January 2016
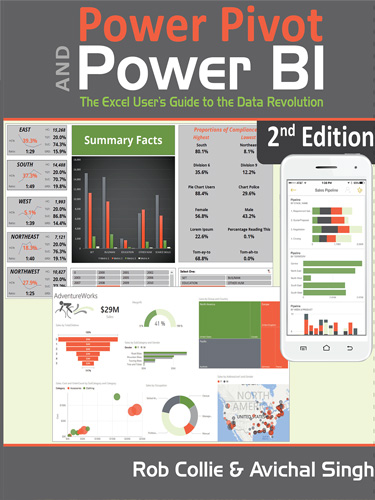
Power Pivot for Excel and its close cousin Power BI Desktop are Microsoft’s tightly-related pair of revolutionary analytical tools – tools that are fundamentally changing the way organizations work with data.
December 2015
Data analysis expressions (DAX) is the formula language of PowerPivot and Power BI. Simply reading a book is normally not enough to help Excel users learn DAX skills – you need to complete exercises and get plenty of practice to make the transition.
December 2015
Despite the moniker "data monkey", we information workers are often more like data magicians. Our data seldom enters our world in a ready-to-consume format; it can take hours of cleaning, filtering, and reshaping to get things ready to go. Power Query will make this process faster the first time and reduce it to a single button click every subsequent time.
Pivot Table Data Crunching: Microsoft Excel 2016
November 2015
Use Excel 2016 pivot tables and pivot charts to produce powerful, dynamic reports in minutes instead of hours… understand exactly what’s going on in your business… take control, and stay in control! Even if you’ve never created a pivot table before, this book will help you leverage all their amazing flexibility and analytical power.


